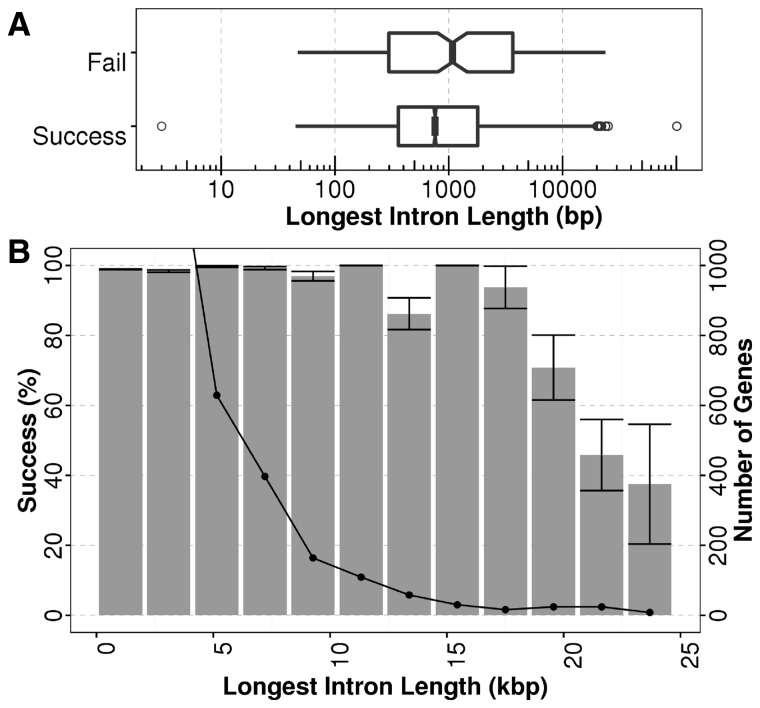
Fig. 4.
(A) Longest intron length comparison between the C.elegans target genes that are successfully assembled (top) versus those that failed (bottom). Notches in the boxes represent a 95% confidence interval around the median. The length difference between two groups, represented on a logarithmic scale on the x-axis, is found to be statistically significant by t-test (P = 1.5 × 10 − 8). This analysis yields the same result for gene length comparison (Supplementary Fig. S2) B) Proportion of successful gene assemblies versus longest introns (bars) with number of gene in each bin (lines). The first and second bins make up 10 237 and 1496 genes respectively, and make up 86% of all genes in the dataset (Supplementary Fig. S1)

