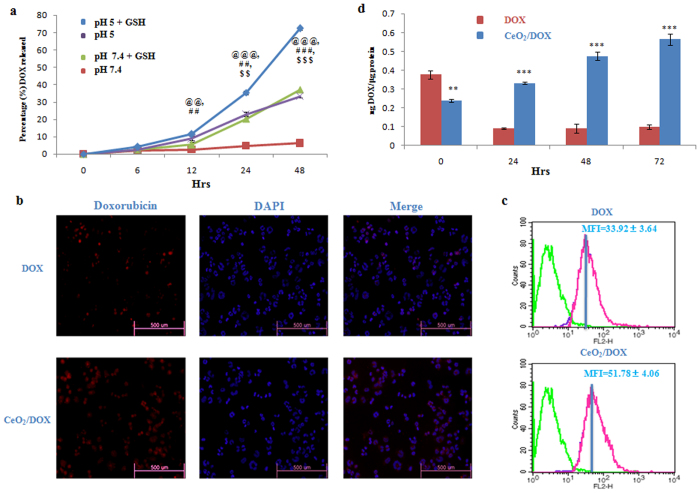
Figure 2.
Intracellular uptake of CeO2/DOX nanoparticles and release of DOX from CeO2/DOX nanoparticles. (a) DOX release profiles of the CeO2/DOX nanoparticles in PBS under different conditions at 37 °C. The GSH concentration was fixed at 10 mM. The equivalent DOX concentration was 5 μg/mL. @p < 0.05, @@p < 0.01 and @@@p < 0.01 versus the pH 7.4 group, #p < 0.05, ##p < 0.01 and ###p < 0.01 versus the pH 7.4,GSH group, $p < 0.05, $$p < 0.01 and $$$p < 0.01 versus the pH 5 group. (b,c) Cellular uptake of free DOX and CeO2/DOX nanoparticles after incubation of A2780 cells with a 2 μg/mL equivalent DOX concentration for 3 h, measured by fluorescence microscopy and FACS; MFI, mean fluorescence intensity. (d) Quantitative evaluation of intracellular DOX released from CeO2/DOX. A2780 cells were first treated with a 2 μg/mL equivalent DOX concentration for 3 h (taken as the 0 time-point), washed, and left untreated for a further 24, 48, and 72 h in DOX-free medium. All values are expressed as mean ± SD. *p < 0.05, **p < 0.01, and **p < 0.001 versus the free DOX-treated group.

