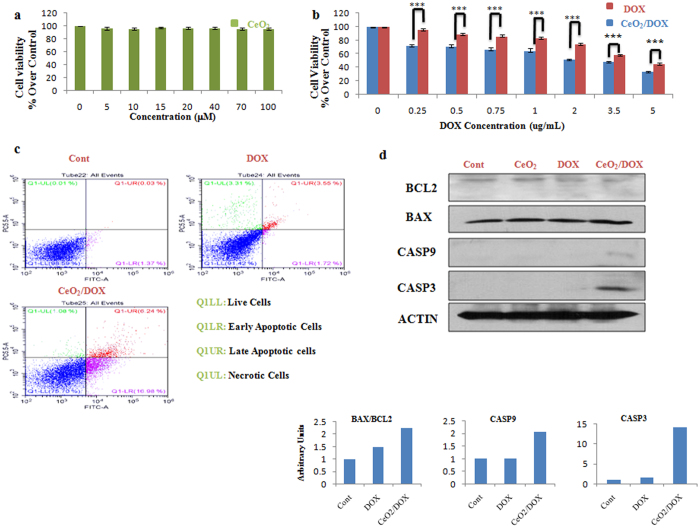
Figure 5.
In vitro cytotoxicity of CeO2/DOX in SKOV3 ovarian cancer cells. (a,b) Cell viability relative to the control (100%). Cells were treated with different concentrations of CeO2, free DOX, or CeO2/DOX for 3 h. The cells were then washed and further cultured in fresh media for 72 h in the absence of any DOX and nanoparticles. All values are expressed as mean ± SD. *p < 0.05, **p < 0.01, and ***p < 0.001 versus the free DOX-treated group. (c) Apoptosis (dot plot distribution and % apoptosis calculations) measured by Annexin V/PI assay after exposure to 0.25 μg/mL equivalent doxorubicin for 3 h followed by washing and cultured for further 72 h in DOX free media. (d) Western blot analysis of apoptotic proteins. Cells were treated with a 0.25 μg/mL equivalent DOX concentration (either free DOX or CeO2/DOX) or with 5 μM CeO2 for 3 h, washed, and further cultured for 72 h. Densitometric analysis was carried out using Image J software.

