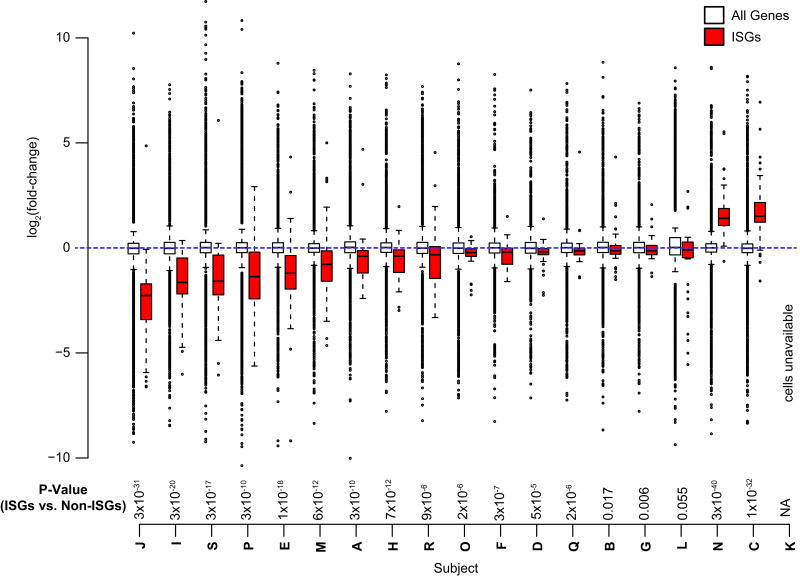
FIGURE 2. Activated CD4+ T cells of patients following ART initiation have decreased expression of interferon stimulated genes (ISGs) compared to pre-ART.
Boxplots comparing the log2 fold-changes (y-axis) of all genes (unfilled) with ISGs (red) for each of the 19 subjects in the study. P-value shown is a Wilcoxon rank-sum test of the fold-changes of ISGs compared to the fold-changes of all other genes per individual.

