
Figure 6. Proximodistal heterogeneity of excitation and inhibition in the CA3 recurrent network.
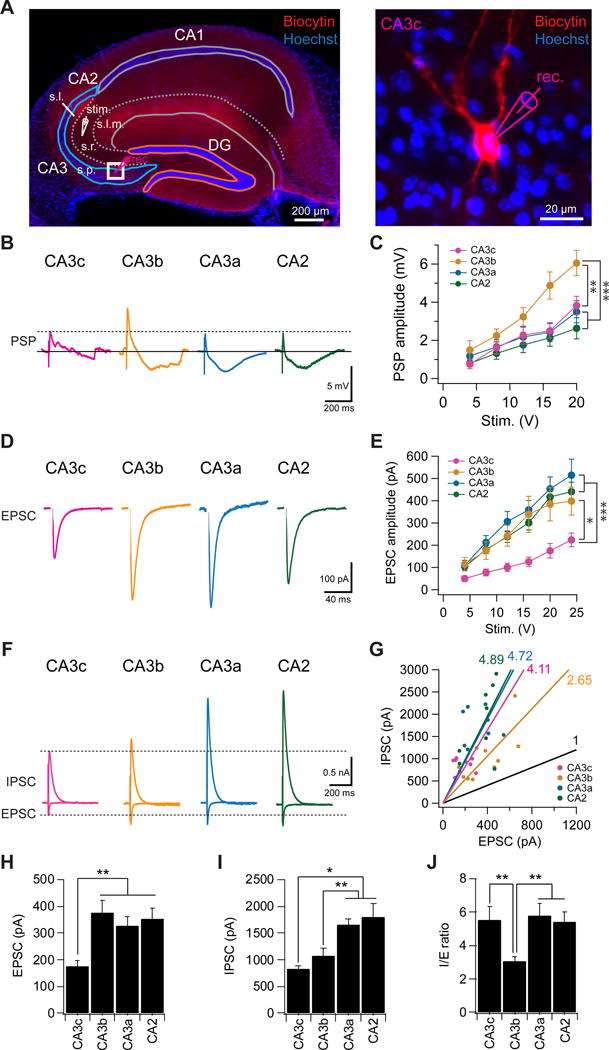
(A) (Left) A representative hippocampal slice showing a CA3c PN undergoing whole cell recording in response to stimulation of CA3 recurrent collaterals using a stimulating electrode placed in the middle of CA3 stratum radiatum. (Right) Expanded view of the CA3c neuron (left). Note we positioned the stimulating electrode based on the position of the recorded neuron across the transverse axis to keep the distance between neuron and stimulating electrode constant (about 400 μm). s.l.m., stratum lacunosum moleculare; s.r., stratum radiatum; s.l., stratum lucidum, s.p., stratum pyramdale.
(B) Sample traces of PSPs, from PNs in indicated regions, evoked by electrical stimulation of recurrent inputs with a stimulating electrode in SR. Inhibition was intact.
(C) Input-output relation of PSP amplitude plotted against stimulation intensity. ***p < 0.001. **p < 0.01. Error bars show SE. n = 9–11 neurons per group.
(D) Sample traces EPSCs evoked by electrical stimulation of recurrent inputs with membrane held at −75 mV.
(E) Input-output relation of EPSC amplitude plotted against stimulation intensity. ***p < 0.001. *p < 0.05. Error bars show SE. n = 9–12 neurons per group.
(F) Sample IPSC and EPSC traces recorded at a holding potential of 0 mV and −75 mV, respectively.
(G) IPSC plotted against EPSC for individual cells. Numbers show the slopes for each group. Black line indicates an I/E ratio of 1.
(H and I) Mean EPSC (H) and IPSC (I) amplitude in response to electrical stimulation (16 V). Error bars show SE. **p < 0.01. *p < 0.05. n = 9–13 neurons per group.
(J) Mean I/E ratio. Error bars show SE. **p < 0.01. n = 9–13 neurons per group.