Fig. 2.

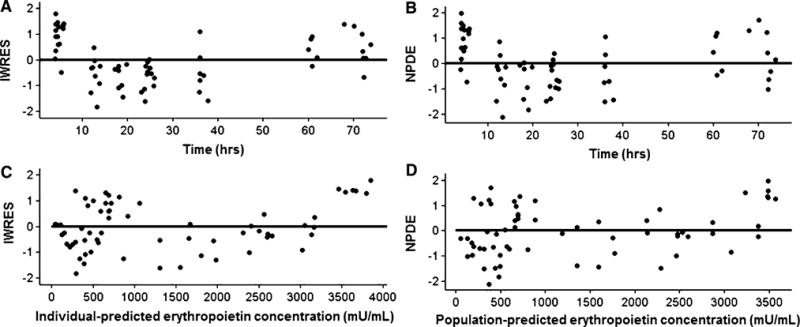
The individual weighted residuals (IWRES) and normalized prediction distribution errors (NPDE) vs. time- and population-predicted erythropoietin concentrations are presented in a–d. The solid line is the reference line at zero

The individual weighted residuals (IWRES) and normalized prediction distribution errors (NPDE) vs. time- and population-predicted erythropoietin concentrations are presented in a–d. The solid line is the reference line at zero