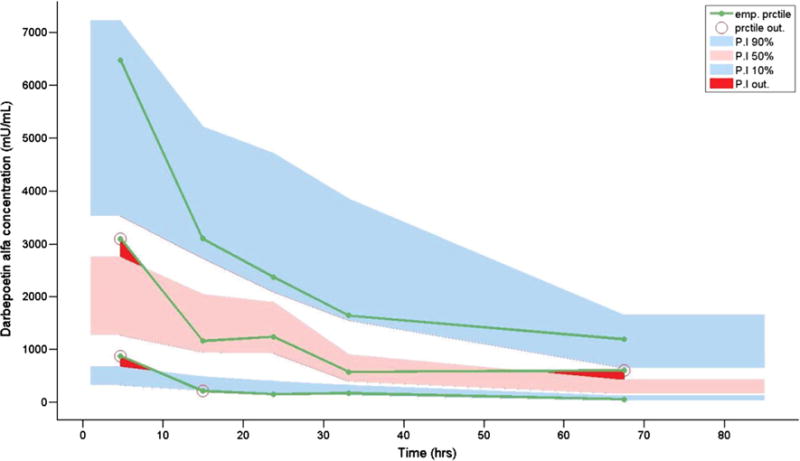
Fig. 3.

Visual predictive check of the final neonatal darbepoetin alfa model. The blue shading represents the 10th and 90th percentiles. Pink shading represents the 50th percentile. The open circles and red shading represent data that did not fall within the 10th, 50th, or 90th percentiles. emp empirical, prctile percentile
