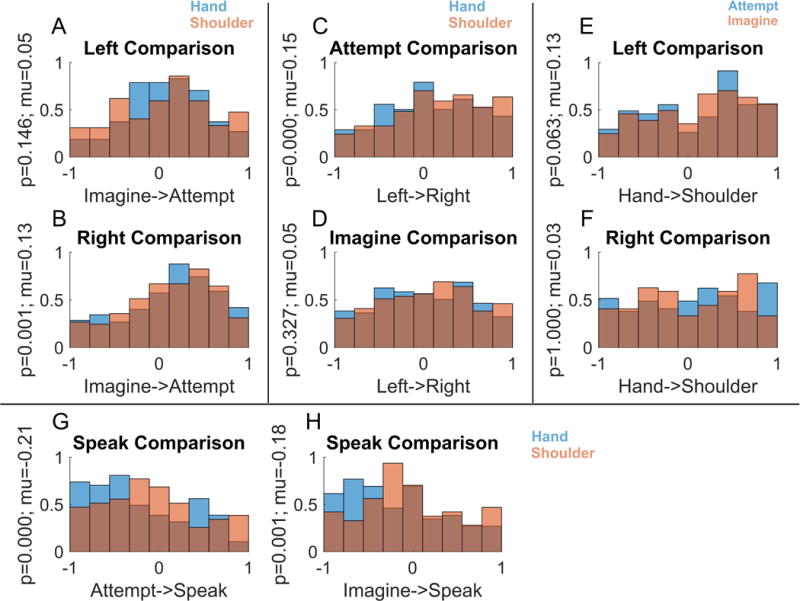
Figure 4. Specificity of coding for motor variables.

Each panel (A–F) shows the degree to which neurons code one variable exclusively, its opposite, or respond similarly for both. Only units with significant modulation for at least one condition in the comparison are included in the analyses (p < 0.05, Bonferroni corrected). (A–B) Distribution of the degree of specificity to the imagine or attempt strategies in the population during trials using different sides, showing only units responsive to one or both strategies. (C–D) Distribution of the degree of specificity to the left or right side in the population for different strategies. (E–F) Distribution of the degree of specificity to the hand or shoulder in the population during trials using different sides. (G–H) Distribution of the degree of specificity to attempted/imagined movements compared to speaking.
