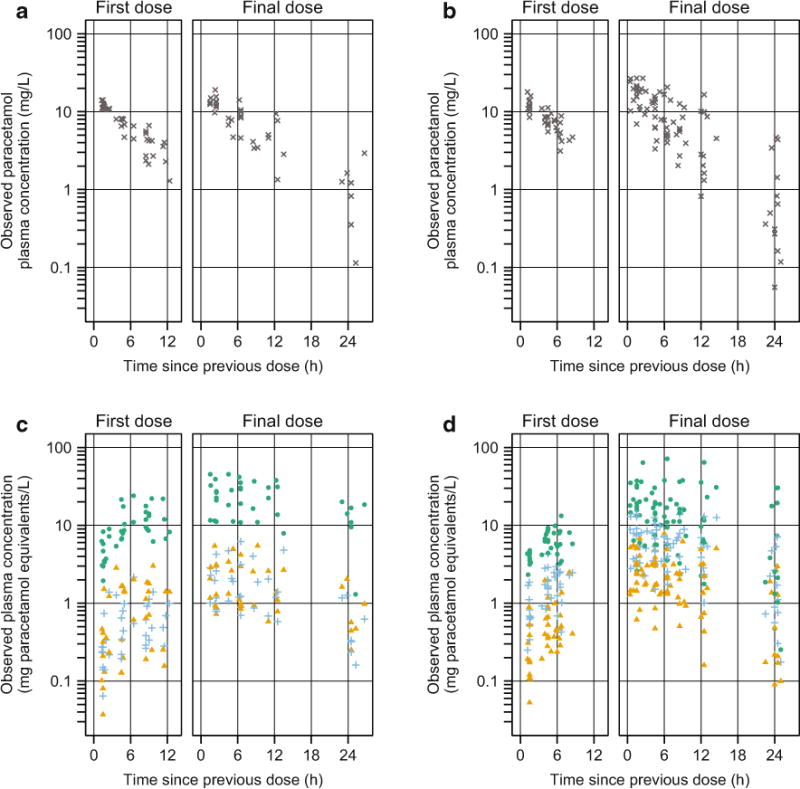
Fig. 2.

Observed plasma concentrations vs. time for neonates who received five doses at 12-h intervals (a, c 15-mg/kg per dose) and for neonates who received seven doses at 8-h intervals (b, d 15-mg/kg per dose). a, b Show paracetamol concentrations (gray x marks); c, d show concentrations of paracetamol-glucuronide (blue plus signs), paracetamol-sulfate (green circles), and the combined oxidative pathway metabolites (paracetamol-cysteine and paracetamol-N-acetylcysteine, orange triangles)
