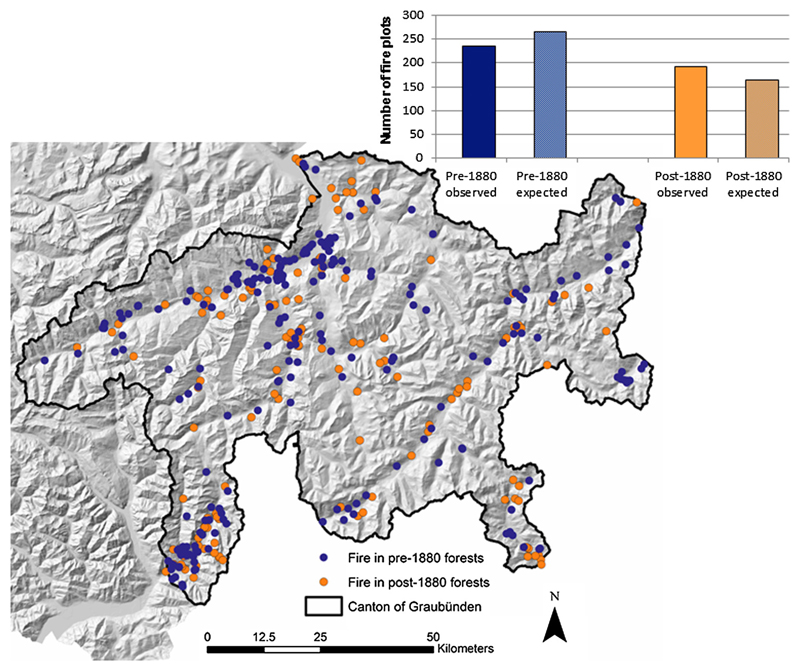
Fig. 6.
Representation of forest fire in NFI-plots which overlap with pre-1880 forests (blue dots, n = 236) and post 1880-forests (orange dots, 193 Fires) in the Canton Graubünden (eastern Switzerland). Barplots with corresponding colours represent the frequency of observed fire areas in pre- and post-1880 forests relative to the expected frequencies according to the area of each forest type.

