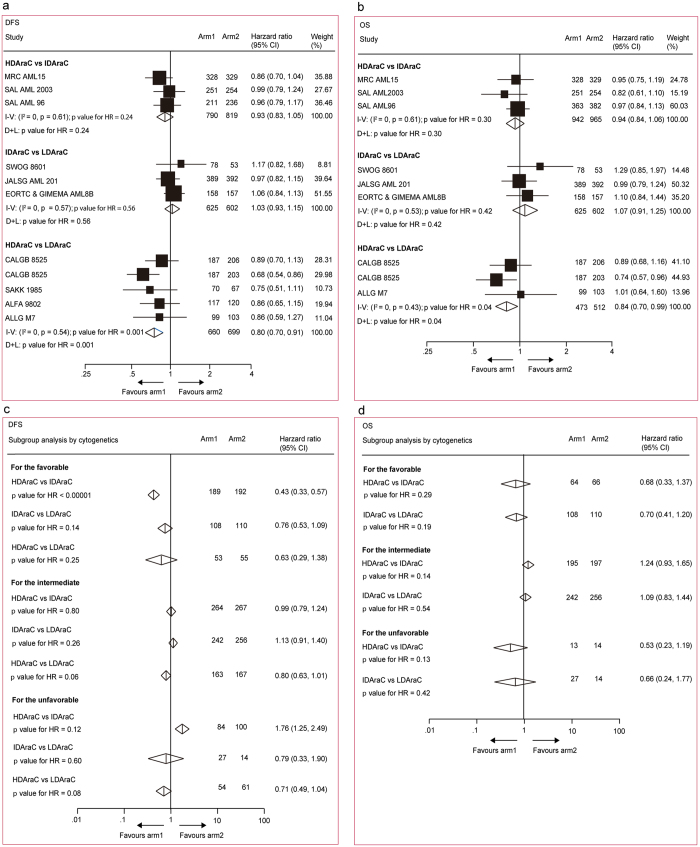
Figure 2.
Direct meta-analysis for disease-free survival and overall survival. (a) and (b) All patients. (c) and (d) According to cytogenetic risk groups. The size of the boxes is proportional to the amount of data contained in each data line. The bars indicate 95% confidence intervals (CIs). HDAraC, high-dose cytarabine (>2 g/m2, ≤3 g/m2 twice daily); IDAraC, intermediate-dose cytarabine (≥1 g/m2, ≤2 g/m2 twice daily); LDAraC, low-dose cytarabine (<1 g/m2 twice daily); I–V = inverse variance. D + L = DerSimonan and Laird.

