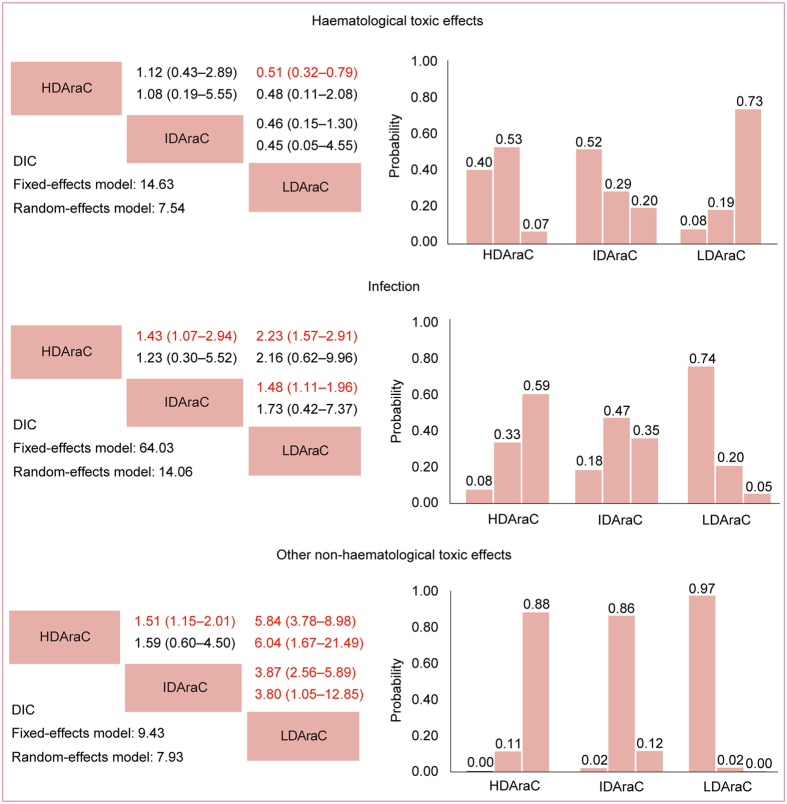
Figure 5.
Network meta-analysis for haematological toxic effects, infection and other non-haematological toxic effects. Upper triangles denote pooled hazard ratios (ORs). The column dose range is compared with the row dose range. In each cell, the first and second line used fixed-effect and random-effect model. Numbers in parentheses indicate 95% credible intervals. HRs with Bayesian p value < 0.05 are in red. Lower triangles denote the Bayesian deviance information criterion (DIC) statistics from the fixed- and random-effects models. Cumulative probabilities of each dose range ranking first, second and third best based on the corresponding effect-models with lower DIC values.

