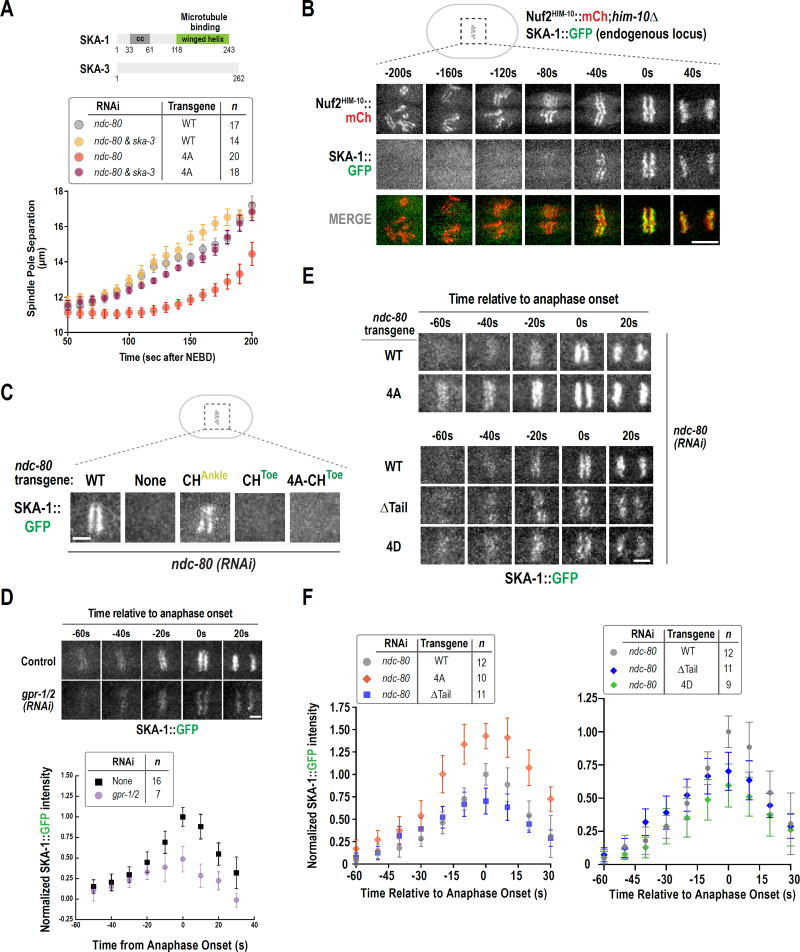
Figure 3. The non-phosphorylatable NDC-80 N-tail mutant suppresses spindle elongation via the SKA complex.
(A) Schematics of C. elegans SKA complex subunits SKA-1 and SKA-3. Spindle pole separation analysis for the indicated conditions. WT and 4A alone data are same as in Fig. 1B and Fig. 2C, respectively. Error bars are the 95% confidence interval.
(B) Stills from a time-lapse movie of a one-cell embryo co-expressing mCherry-tagged NDC-80 complex and GFP-tagged SKA complex. Scale bar, 5 µm.
(C) SKA-1::GFP localization in the indicated conditions. 10–12 embryos were imaged per condition. Scale bar, 2.5 µm.
(D) (top) Stills from time-lapse movies of SKA-1::GFP localization in control and gpr-1/2(RNAi). (bottom) Quantification of SKA-1::GFP chromosomal intensity relative to anaphase onset. Error bars are the 95% confidence interval. Measured fluorescence intensities were normalized to the averaged maximal intensity value in control.
(E) Stills from time-lapse movies of SKA-1::GFP chromosomal localization in the indicated conditions. Scale bar, 2.5 µm.
(F) Quantification of SKA-1::GFP chromosomal intensity relative to anaphase onset for the indicated conditions, performed as in Fig. 3D above. See also Fig. S4.

