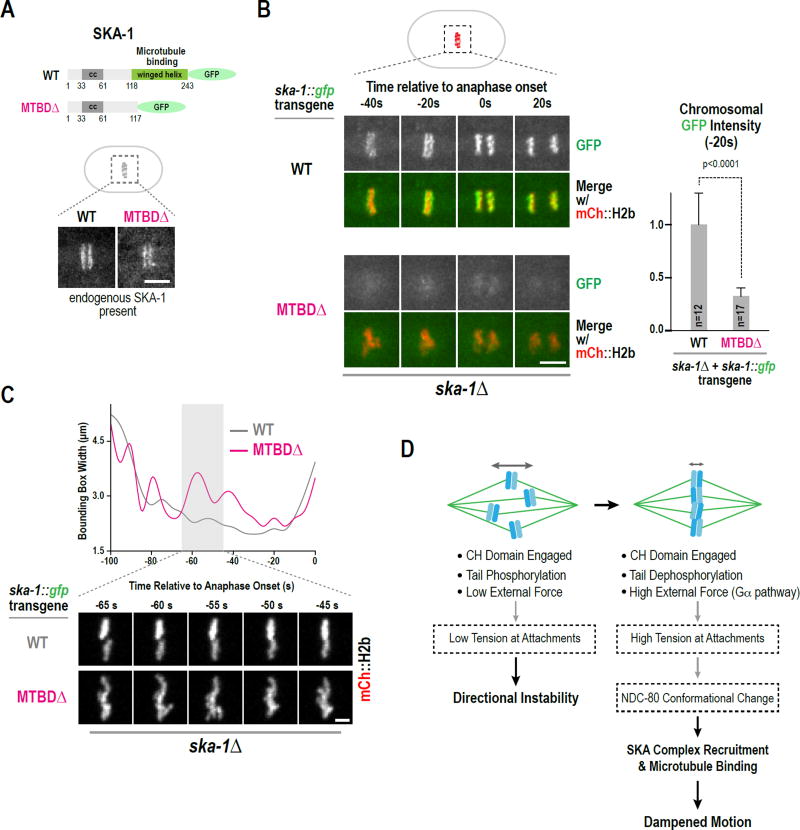
Figure 5. The microtubule-binding domain of SKA-1 contributes to SKA complex localization and function.
(A) Schematic of transgene-expressed GFP fusions of SKA-1; the microtubule-binding domain deletion (MTBDΔ) is identical to the one characterized in vitro (Schmidt et al., 2012). Images below show metaphase stage embryos in strains where endogenous SKA-1 is present. Scale bar, 5 µm.
(B) Stills from time-lapse movies for the indicated conditions. The graph on the right plots background-subtracted chromosomal GFP fluorescence for the frame (−20s) prior to anaphase onset. Measurements were normalized to the mean value of wild-type SKA-1::GFP. Error bars are the 95% confidence interval. Scale bar, 5 µm.
(C) Examples of bounding box width analysis of mCherry::H2b timelapse sequences, performed as in Fig. 4B; stills below illustrate chromosome behavior for the two analyzed conditions. Scale bar, 2.5 µm.
(D) Model for dampening of chromosome motion after biorientation. Boxes with dashed lines contain speculations discussed in the text. See also Fig. S5.

