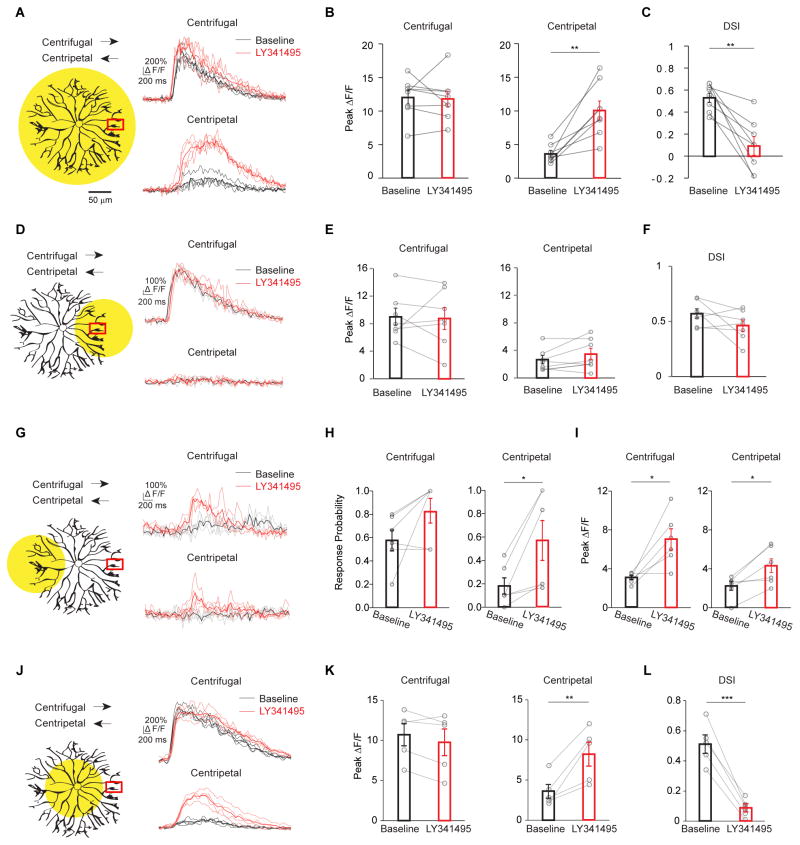
Figure 2. mGluR2 signaling promotes electrotonic isolation of SAC dendritic branches.
A – C. mGluR2 blockade selectively increases centripetal-direction response during full field linear motion. See also Figure S3.
A. Left: same as full-field stimulus in Figure 1D, schematic shows the spatial extent of the motion stimulus and the location of the calcium imaging window. Arrows indicate motion directions. Right: GCaMP6M fluorescence traces under this stimulus condition before (black) and after adding LY341495 (red). Dark traces represent mean values and light traces represent individual trials for A, D, G and J.
B. Summary of peak fluorescence of individual SACs before and after adding LY341495 under the condition shown in a. Centrifugal: baseline, 12.1 ± 1.0; LY341495, 11.8 ± 1.2; p = 0.80. Centripetal: baseline, 3.6 ± 0.5; LY341495, 10.1 ± 1.4; **p = 0.0018. n = 8 cells (97 varicosities) from 7 mice.
C. Same as B, summary of direction selectivity index (DSI) values. Baseline, 0.54 ± 0.04; LY341495, 0.09 ± 0.08; **p = 0.0016.
D – F. mGluR2 blockade has no effect on the SAC calcium response when the motion stimulus is restricted to the local dendritic branches containing the imaging window.
D. Left: schematic same as subregion 1 in Figure 1D. Right: GCaMP6M fluorescence traces of a varicosity before (black) and after adding LY341495 (red).
E. Summary of peak fluorescence of individual SACs before and after adding LY341495 under the condition shown in D. Centrifugal: baseline, 8.9 ± 1.3; LY341495, 8.8 ± 1.6; p = 0.88. Centripetal: baseline, 2.6 ± 0.6; LY341495, 3.5 ± 0.8; p = 0.17. n = 7 cells (57 varicosities) from 6 mice.
F. Same as e, summary of DSI values. Baseline, 0.57 ± 0.04; LY341495, 0.46 ± 0.05; p = 0.15.
G – I: mGluR2 blockade enhances the calcium response of SAC varicosities when the motion stimulus is restricted to the dendritic sector located opposite the imaging window.
G. Left: schematic same as subregion 5 in Figure 1D. Right: GCaMP6M fluorescence traces under the stimulus condition shown on the left.
H. Summary of the response probability during motion in the centrifugal and centripetal directions under the stimulus condition shown in G. Response probability is calculated as the number of trials with detectable calcium responses divided by the total number of trials (See Methods). Centrifugal: baseline, 0.55 ± 0.09; LY341495, 0.83 ± 0.11; p = 0.097. Centripetal: baseline, 0.17 ± 0.07; LY341495, 0.64 ± 0.14; *p = 0.02. n = 6 cells (53 varicosities) from 6 mice.
I. As in G, summary of peak amplitude of the propagated responses. Peak amplitude is calculated only from the trials with detectable calcium responses. Centrifugal: baseline, 3.0 ± 0.2; LY341495, 7.0 ± 1.1; *p = 0.016. Centripetal: baseline, 2.2 ± 0.5; LY341495, 4.3 ± 0.8; *p = 0.018.
J – L: mGluR2 blockade enhances centripetal-direction responses of SAC varicosities during perisomatic motion stimulation.
J. Left: schematic same as subregion 3 in Figure 1D. Right: GCaMP6M fluorescence traces under the stimulus condition shown on the left.
K. Summary of peak fluorescence of individual SACs before and after adding LY341495 during perisomatic stimulation (data combined for subregions 3 and 4 in Figure 1D). Centrifugal: baseline, 10.7 ± 1.4; LY341495, 9.8 ± 1.7; p = 0.13. Centripetal: baseline, 3.6 ± 0.9; LY341495, 8.2 ± 1.5; *p = 0.01. n = 5 cells (39 varicosities) from 5 mice.
L. Same as K, summary of DSI values. Baseline, 0.51 ± 0.06; LY341495, 0.09 ± 0.03; ***p = 0.0001.

