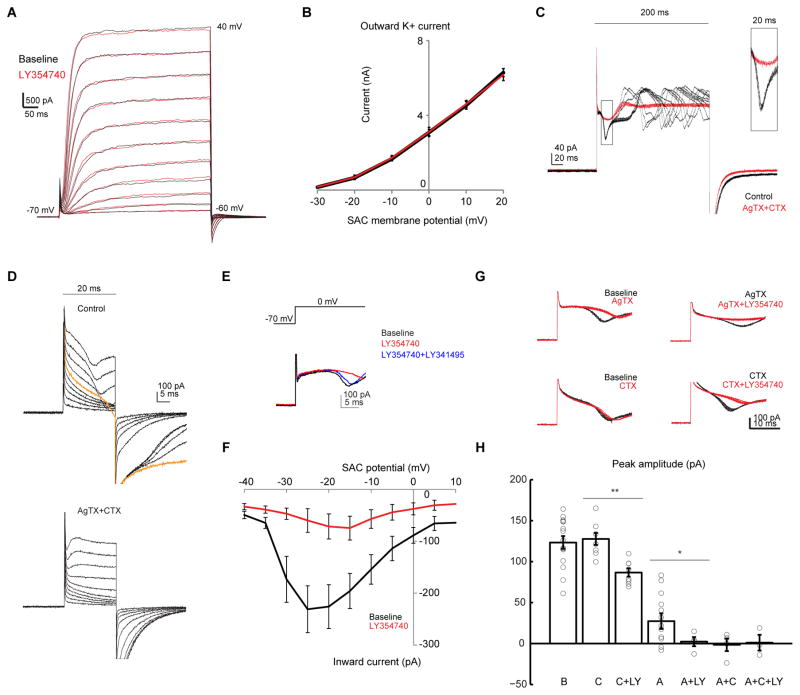
Figure 3. mGluR2 inhibits voltage-gated calcium channels, but not voltage-gated potassium channels in SACs.
A. Voltage clamp traces of a SAC in potassium-based internal solution during steps of depolarization at 10 mV increment before (black) and after adding the mGluR2 agonist LY354740 (red).
B. Relationship between average steady-state outward potassium current and membrane potential in SACs before (black) and after LY354740 (red). Repeated measures ANOVA p = 0.49, n = 4 cells from 3 mice.
C. Example voltage clamp traces of a SAC in cesium-based internal solution at baseline and after addition of AgTX and CTX (AgTX + CTX) during steps of depolarization from −70 mV to 0 mV for 200 ms. For each condition, traces represent the overlay of 10 repetitions. Capacitive currents are clipped for clarity for C, D and E. Inset shows the boxed region at higher magnification.
D. Example voltage clamp traces of a SAC at the baseline (upper), and after addition of AgTX and CTX (lower) during steps of 20 ms depolarization from −70 mV at 10 mV increment. Orange trace represents the onset of the inward calcium transient.
E. Example voltage clamp traces of a SAC at the baseline, and after sequential addition of LY354740 and then the competitive antagonist LY341495 (LY354740 + LY341495).
F. Relationship between peak of the inward current and membrane potential in SACs before and after LY354740. Repeated measures ANOVA **p = 0.0017, n = 9 cells from 5 mice.
G. Example traces of the same SACs before (black) and after (red) application of selective calcium antagonist and LY354740. For each condition, traces represent the overlay of 10 repetitions.
H. Summary of effects of CTX (C), AgTX (A) and LY354740 (LY) on the peak amplitude of the initial calcium transient. Baseline, 123.4 ± 7.8, n = 14 cells from 6 mice; C, 127.7 ± 7.3, n = 8 cells; C + LY, 86.7 ± 5.1, n = 8 cells; A, 27.4 ± 9.5, n = 14 cells; A + LY, 2.3 ± 5.6, n = 4 cells; A + C, −1.5 ± 7.7, n = 4 cells; A + C + LY, 1.1 ± 9.7, n = 3 cells; C versus C + LY, **p = 0.0006; A versus A + LY, * p = 0.02.
See also Figure S4.

