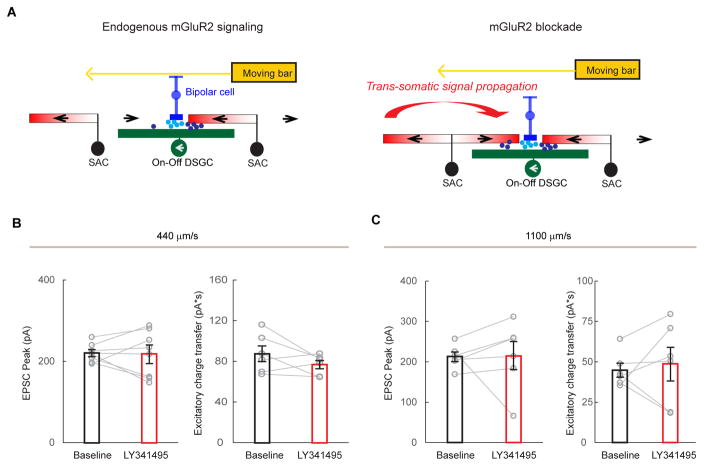
Figure 5. mGluR2 blockade does not significantly change preferred-direction excitation onto DSGCs.
A. A model of the effect of mGluR2 blockade on DSGC excitation. The total excitation comes from two sources: glutamate (light blue dots) released from bipolar cells and acetylcholine (dark blue dots) from SACs. SACs form cholinergic synapses with DSGCs in an isotropic pattern. During mGluR2 blockade, enhanced trans-somatic propagation of depolarization in SACs causes increased acetylcholine release only from the centripetally activated SAC sectors, but not from centrifugally activated sectors. The glutamate release is not affected. Therefore, in contrast to the inhibitory inputs, the effect of mGluR2 blockade on the overall excitatory inputs is less pronounced. Also see Discussion.
B. Summary of EPSC peak amplitude and charge transfer in the preferred direction at the speed of 440 μm/s before and after adding LY341495. Peak: baseline, 220.2 ± 8.9; LY341495, 217.4 ± 22.8; p = 0.89, n = 7 cells from 5 mice. Charge transfer: baseline, 87.5 ± 7.8; LY341495, 76.8 ± 4.0; p = 0.19.
C. Summary of EPSC peak amplitude and charge transfer in the preferred direction at the speed of 1100 μm/s before and after adding LY341495. Peak: baseline, 212.2 ± 11.8; LY341495, 215.5 ± 34.8; p = 0.93, n = 6 cells from 4 mice. Charge transfer: baseline, 44.8 ± 4.3; LY341495, 48.5 ± 10.4; p = 0.70.

