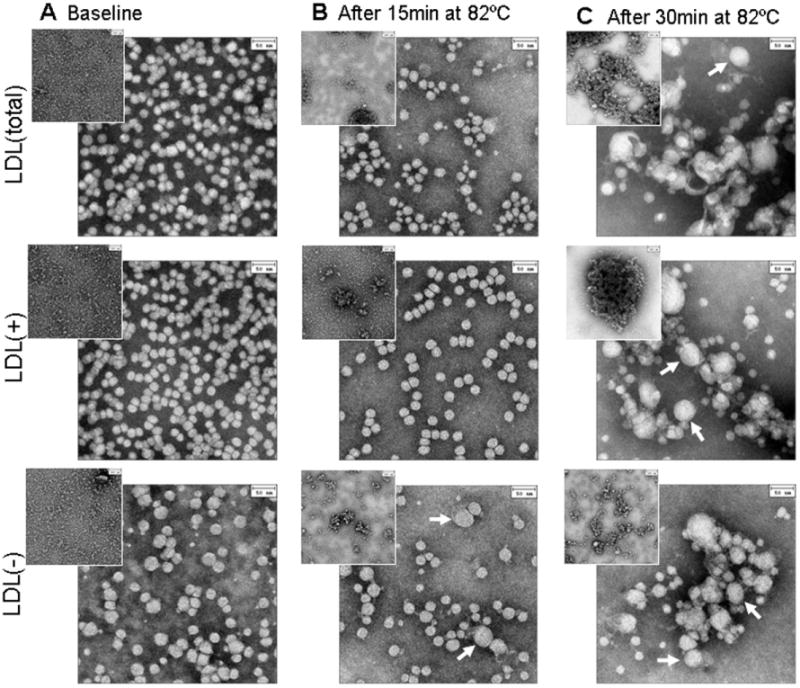
Fig. 3.

Electron micrographs of negatively stained LDL(total), LDL(+) and LDL(−). Intact particles (left) were incubated at 82 °C in T-jump experiments as described in Fig. 2; sample aliquots were taken after 15 min (middle) or 30 min (right) of incubation. TEM was performed as described in the Experimental Section. White arrows indicate fused LDL particles. Inserts: zoomed-out views illustrate LDL aggregation. The bar size is 50 nm.
