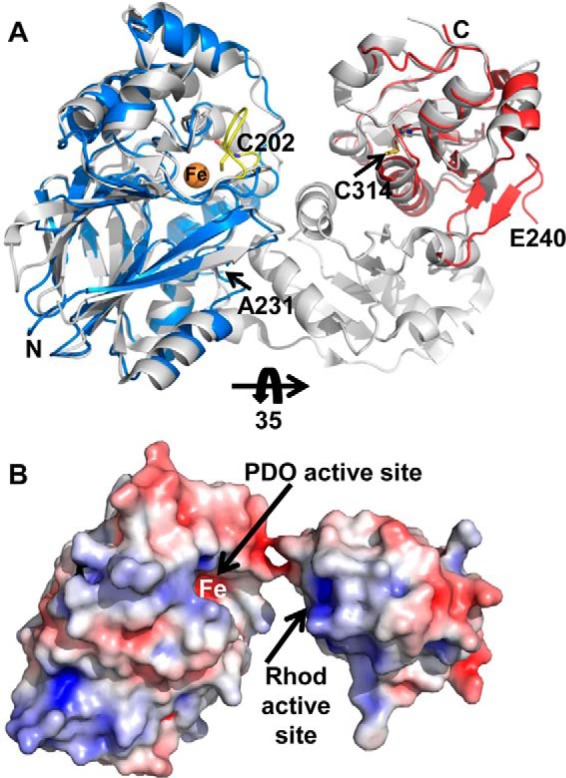
Figure 9.

Modeling of potential BpPRF domain interaction interface. A, overlay of BpPRF PDO domain (blue) and the BpPRF rhodanese domain (red) with the PDO domain and catalytic rhodanese domain of AaPRF (PDB code 3TP9) (shown in gray). The active-site loop of AaPRF (yellow) with Cys-202 faces the iron center (orange sphere) in the PDO domain. B, electrostatic surface potential of the BpPRF domains in the same orientation as in A but rotated by 35°. The arrows highlight locations of the PDO- and rhodanese (Rhod)-active sites. Positive and negative electrical potential are shown in blue and red, respectively, and represent a range of −5 to +5 kT/e.
