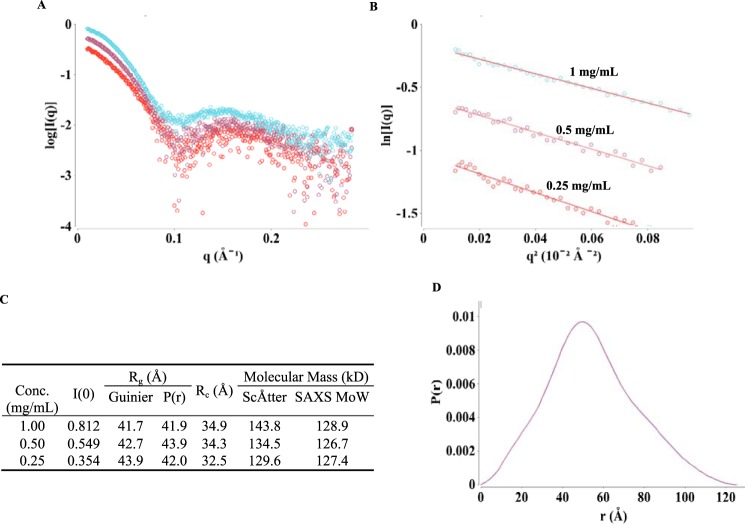
Figure 4.
SAXS data and analyses of the Rho*–GT* complex. A, SAXS scattering profiles from protein concentrations of 1, 0.5, and 0.25 mg/ml (colored cyan, purple, and red, respectively). (Each curve shown is the average of 10 scattering curves.) B, Guinier plots for q*Rg <1.3 region of the scattering curve. C, SAXS parameters and calculation results. D, pair distribution function calculated from 1 mg/ml scattering profile.

