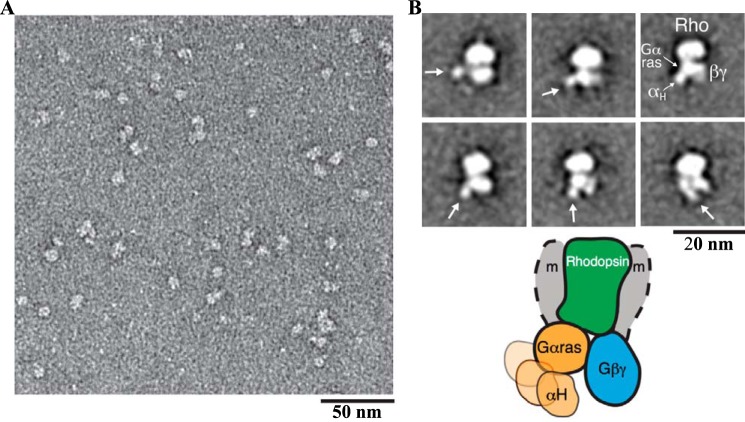
Figure 6.
EM 2D projection analysis of the Rho*–GT* complex. A, raw EM image of the detergent-solubilized Rho*–GT* complex embedded in negative stain. B, representative EM class averages of the Rho*–GT* complex (the positions of the αΤ* helical domain are indicated by an arrow). The schematic model represents the conformations reflected by the EM averages, depicting the variable positioning of the helical domain (the position of the detergent micelle is indicated by gray shaded arcs and labeled with m).

