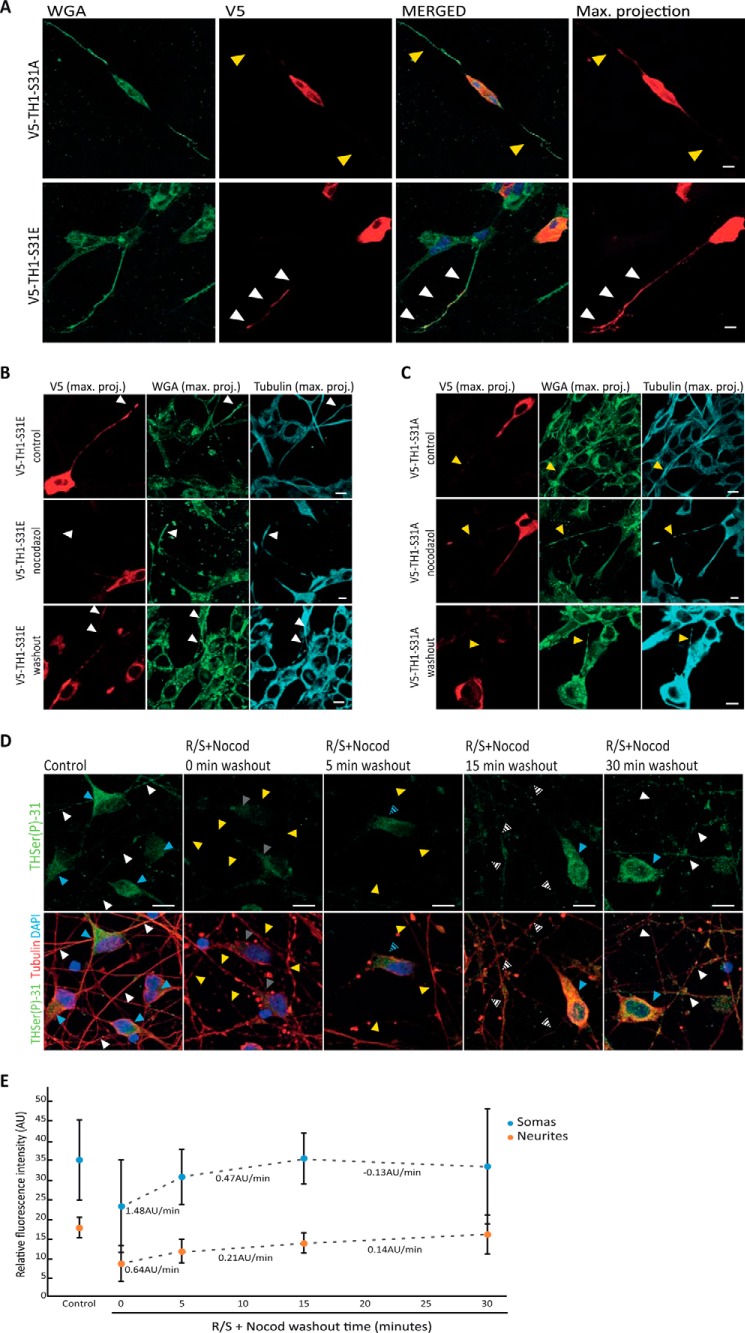
Figure 5.
Transport of THSer(P)-31 to neurite extensions. A, distribution of V5-TH1-S31A– and V5-TH1-S31E–expressing neuroblastoma detected by V5 staining (red). Cellular membranes were stained using WGA (green). Confocal planes are presented as well as the maximum intensity projection (max. projection) of the V5 signal stack of confocal planes. Nuclei were stained with DAPI (blue). Arrows, presence (white) or absence (yellow) of V5 signal in neurites of V5-positive cells (intense red signal in the soma). B and C, detection of V5 tag in neuroblastoma cells expressing V5-TH1-S31E (B) or V5-TH1-S31A (C) after microtubule depolymerization by a cold shock and nocodazole treatment, followed by 30 min of drug washout. Control cells were processed in parallel but were not subjected to nocodazole. All samples were stained for V5 (red), tubulin (cyan), and WGA to mark the cells membranes (green) and DAPI to stain the nucleus. Maximum intensity projection of the stack of confocal planes (max. proj.) is presented. Arrows, presence (white) or absence (yellow) of V5 signal in neurites of V5-positive cells (intense red signal in the soma). D, immunofluorescence of iCell DopaNeurons detecting THSer(P)-31 (green) and tubulin (red) in samples treated first with roscovitine/SL327 for inhibition of phosphorylation of TH at Ser-31 and then subjected to a cold shock nocodazole treatment (R/S+ Nocod) for microtubule disassembly before allowing drug washout. Blue and white arrows, control levels of THSer(P)-31 fluorescence in somas and neurites, respectively. Gray and yellow arrows, low levels/absence of THSer(P)-31 fluorescence in somas and neurites, respectively. Intermediate fluorescence levels are indicated with the corresponding striped arrows. In all cases, maximal projections comprehending the whole cell height are shown. E, quantification of the THSer(P)-31 signal of DopaNeuron somas or neurites in control (untreated) samples as well as in samples treated with the R/S+Nocod and subjected to drug washout. Data are shown as average ± S.D. (error bars) (in all cases n = 50), and the changes in fluorescence per time (arbitrary units (AU)/min) are indicated below each pair of time points. ***, p < 0.001. For all confocal images, 10-μm scale bars are shown.

