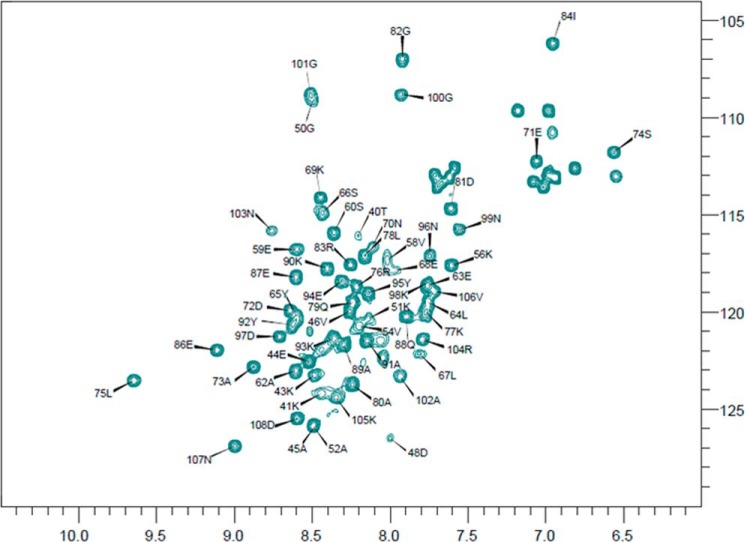
Figure 4.
Assigned 1H-15N HSQC of ComGC recorded at 283K. The HSQC spectrum displays signals from all the backbone and side chain N-H correlations. The 1H chemical shift is plotted along the x axis and the 15N chemical shifts along the y axis. The chemical shifts report on the local chemical environment, and thus very small changes in structure will cause changes in chemical shifts. We observed 65 well defined amide peaks in the ComGC HSQC of which we were able to assign 61 residue-specific resonances (black arrows). Unassigned resonances in the upper right corner are side-chain N-H correlations. Importantly, we do not see any clear indication of more than one conformational state as this would give rise to more chemical shifts in the spectrum.

