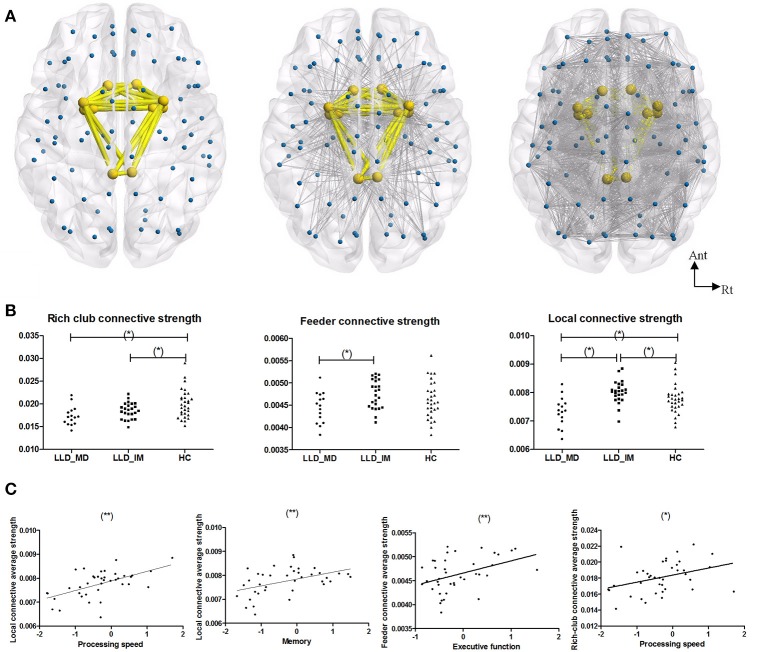
Figure 2.
(A) From left to right, the images represent the rich-club connection, feeder connection and local connection. Rich-club included bilateral olfactory, cingulum_post, amygdala, putamen, and pallidum. The rich-club connections are colored in yellow, and the feeder and local connections are colored in gray. (B) From left to right, the graphs represent group differences in rich-club connective average connective strength, feeder connective average connective strength, and local connective average connective strength in a normalized weight probability connective network among 3 groups (*P < 0.05 in LSD post hoc comparisons). (C) A Pearson correlation between subnetwork average connective strength and cognitive function in LLD groups (LLD-MD+LLD-IM) (adjust with HDRS; *P < 0.05; **P < 0.05/3). The nodes and connections were mapped using BrainNet Viewer software (http://www.nitrc.org/projects/bnv/).

