Fig. 15.

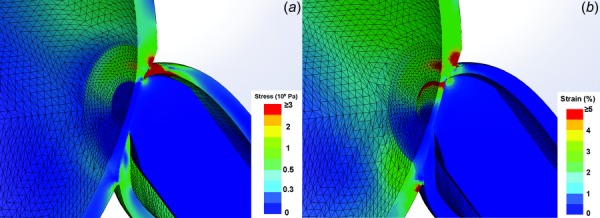
FEA using Mooney–Rivlin hyperelastic model. (a) Magnified view of stress distribution showing maximum stress at the temporal junction of ON, ON sheath, and sclera, which is similar to the linear FEA stress result in Fig. 8(c). (b) Magnified view showing maximum strain at the temporal sclera–ON sheath junction and outer rim of LC that is also similar to the linear FEA strain result in Fig. 8(d).
