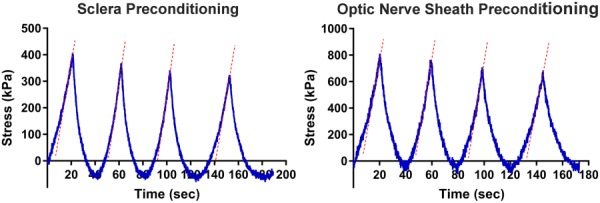
Fig. 3.

Representative preconditioning curves for human sclera and ON sheath. Cyclic loading was up to 5% of the initial length. Dotted lines illustrate the elastic stiffness of each loading cycle; slopes of these lines did not change significantly during cyclic loading.
