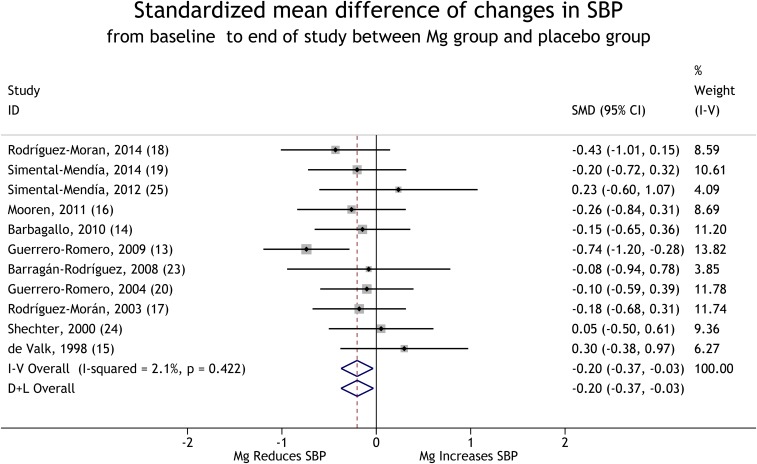
FIGURE 2.
Forest plot of SMDs (95% CIs) of changes in SBP from baseline to the end of trials for the comparison of the Mg-supplementation group with the placebo group. The horizontal line next to each trial indicates the SMD and associated 95% CI. For each study, the size of the rectangular box indicates the relative weight of the trial and the diamond at the center indicates the point estimate. The dashed line indicates where the point estimate in each study lies compared to the pooled estimates, and the line passes through the pooled estimates. The solid line passes through SMD = 0, and 95% CIs that cross it are not significant. The diamonds at the bottom of the figure indicate pooled SMDs (95% CIs). D+L, DerSimonian and Laird for the random-effects method; ID, identifier; I-V, inverse variance for the fixed-effects method; SBP, systolic blood pressure; SMD, standardized mean difference.

