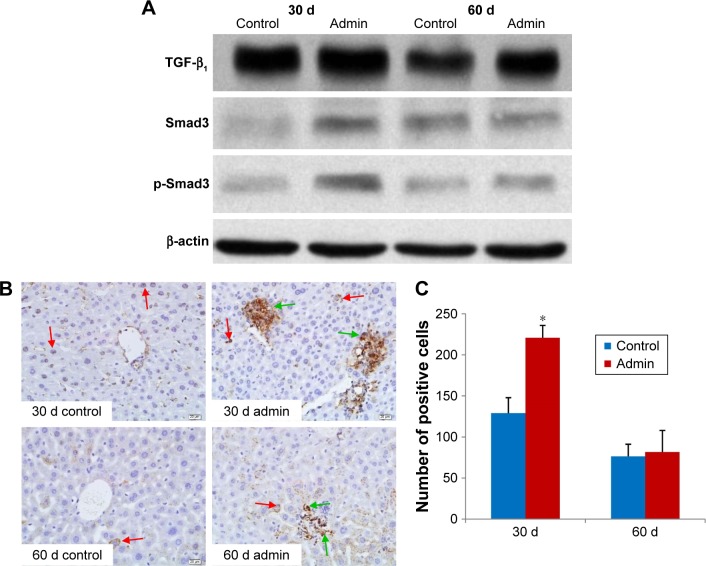
Figure 10.
TGF-β1/Smad3 pathway protein expression in liver.
Notes: (A) Western blotting analysis of TGF-β1, Smad3, and p-Smad3 protein expression in liver of SiO2 NP treated mice at days 30 and 60. Data are representative of at least three mice. (B) Immunohistochemistry staining of p-Smad3 in liver of the SiO2 NP treated mice at days 30 and 60. Representative liver sections taken from the control mice and the SiO2 NP treated mice at 400× magnification. Red arrows denote the p-Smad3 positive hepatocytes, while green arrows denote the p-Smad3 positive cells in granulomas in SiO2 NP treated mice. (C) The number of p-Smad3 positive cells increased in SiO2 NP treated mice at day 30 and day 60. *P<0.05 compared with control group using independent sample t-test. Data are representative of at least six mice.
Abbreviations: Admin, administration; SiO2 NPs, silica nanoparticles.

