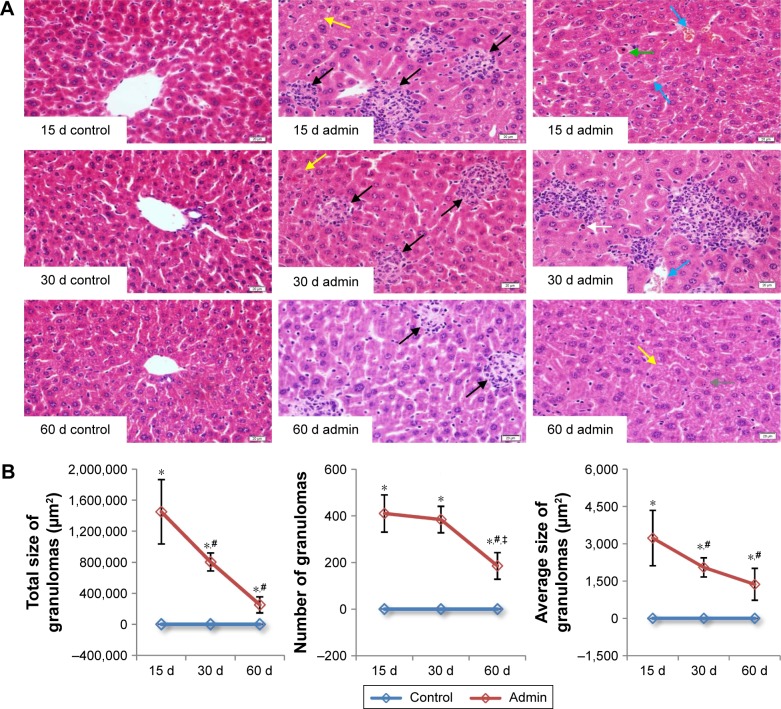
Figure 4.
Histological analyses of liver of the SiO2 NP treated mice.
Notes: (A) Representative liver sections taken from the control mice and SiO2 NP treated mice at days 15, 30, and 60 at 400× magnification. Granulomas and lymphocytic infiltration (black arrows) in the liver, hydropic degeneration in hepatocytes (yellow arrows), hepatic sinusoid and central vein hyperemia (blue arrows), hepatocyte apoptosis (green arrow), eosinophilia infiltration (white arrow), and hepatocyte degeneration and necrosis (gray arrow) was observed in the liver of the SiO2 NP treated mice. (B) The total size, number, and average size of granulomas in the SiO2 NP treated mice at days 15, 30, and 60. Data are expressed as mean ± SD (n=8 or 10). *P<0.05 compared with control group using independent sample t-test, #P<0.05 compared with SiO2 NP treated group at day 15, ‡P<0.05 compared with SiO2 NP treated group at day 30 using ANOVA and LSD. Data are representative of at least eight mice. Scale bar =20 μm.
Abbreviations: admin, administration; SiO2 NPs, silica nanoparticles; LSD, least significant difference.

