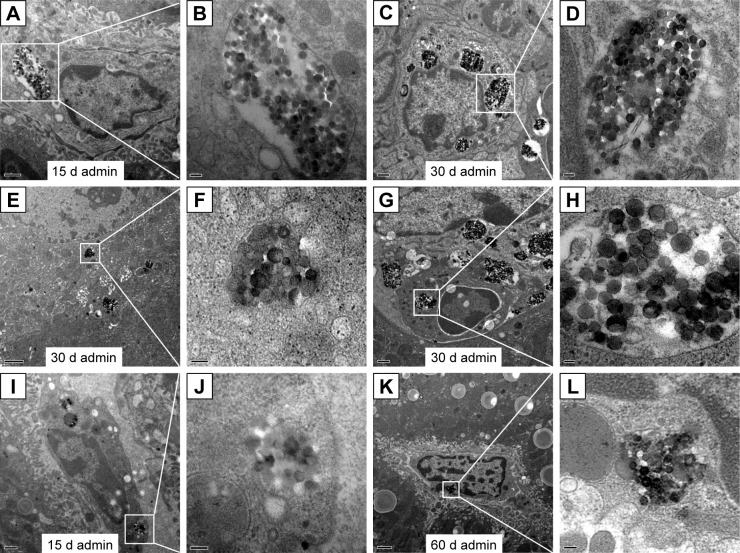
Figure 5.
TEM images of the distribution of SiO2 NPs in the liver of mice at days 15, 30, and 60.
Notes: The regions in the white boxes denote phagolysosomes with endocytosed SiO2 NPs and are magnified on the right-hand side of each image.(A, B) SiO2 NPs in the Kupffer cells in the liver (15 k, 50 k), (C, D) SiO2 NPs in the macrophages in the granuloma (10 K, 50 k), (E, F) SiO2 NPs in the hepatocytes (8 K, 80 k), (G, H) SiO2 NPs in the neutrophils in the granuloma (10 K, 50 k), (I, J) SiO2 NPs in the hepatic stellate cells (12 K, 80 k), (K, L) SiO2 NPs in the fibroblast cells in the liver (6 K, 60 k). Scale bars: (A) 0.5 μm; (B) 100 nm; (C) 0.5 μm; (D) 100 nm; (E)1 μm; (F) 100 nm; (G) 0.5 μm; (H) 50 nm; (I) 0.5 μm; (J) 100 nm; (K) 1 μm; (L) 100 nm.
Abbreviations: admin, administration; TEM, transmission electron microscopy; SiO2 NPs, silica nanoparticles.

