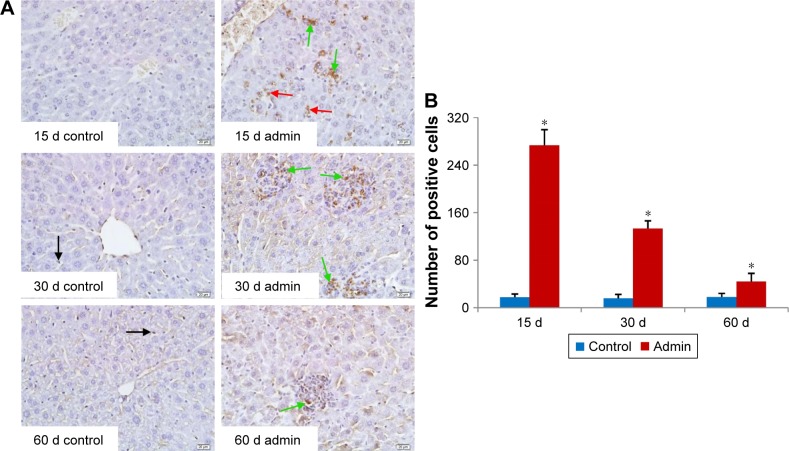
Figure 8.
Apoptosis of the liver induced by SiO2 NPs in mice at days 15, 30, and 60.
Notes: (A) Representative liver sections taken from the control mice and the SiO2 NP treated mice at 400× magnification. Black arrows denote the TUNEL positive apoptotic cells in control group, while red arrows and green arrows denote the TUNEL positive apoptotic hepatocytes and TUNEL positive apoptotic cells in granulomas in the SiO2 NP treated mice, respectively. (B) The number of TUNEL positive cells increased in the SiO2 NPs treated mice at days 15, 30, and 60. *P<0.05 compared with control group using independent sample t-test. Data are representative of at least six mice. Scale bars =20 μm.
Abbreviations: admin, administration; SiO2 NPs, silica nanoparticles.

