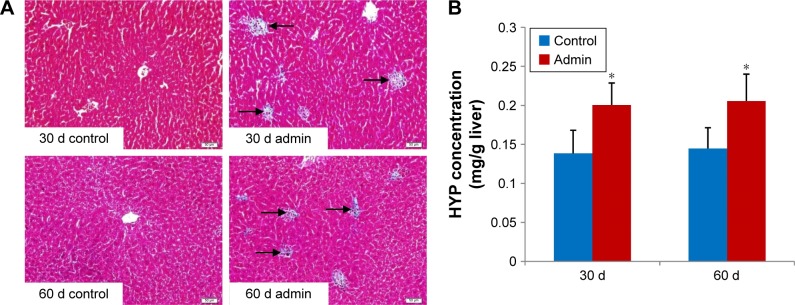
Figure 9.
Collagen fiber level in the liver.
Notes: (A) Photographs of liver sections stained with Masson’s trichrome. Black arrows denote the collagen fibers appearing in granulomas in the SiO2 NP treated mice at days 30 and 60. Data are representative of at least six mice. (B) The hydroxyproline level in the liver of the SiO2 NP treated mice at days 30 and 60. The hydroxyproline level in SiO2 NP treated groups was significantly increased compared with control groups. *P<0.05 compared with control group using independent sample t-test. Data are representative of at least six mice. Scale bar =20 μm.
Abbreviations: Admin, administration; SiO2 NPs, silica nanoparticles; HYP, hepatic hydroxyproline.

