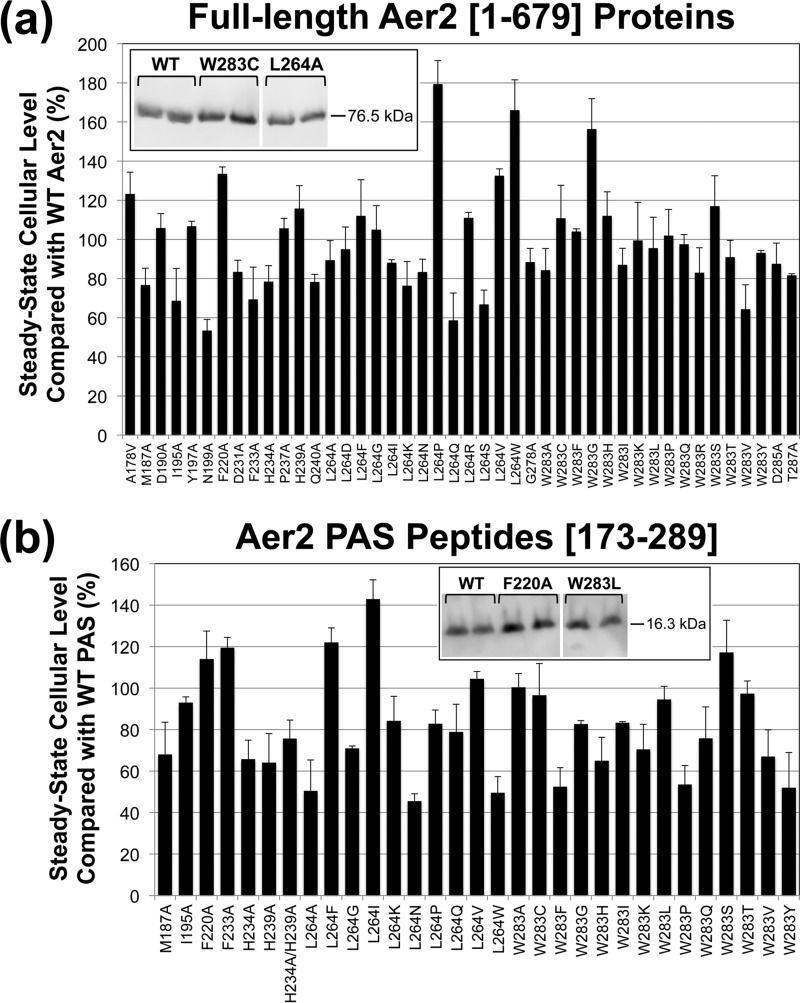
FIG 3.
Steady-state cellular levels of full-length Aer2 proteins and PAS peptides in E. coli. (a) Steady-state levels of full-length Aer2 proteins compared with WT Aer2[1-679] in E. coli BT3388. Aer2 expression was induced with 50 μM IPTG, and protein levels were determined from Western blots, an example of which is shown in the inset box. Lanes are from the same gel; intervening lanes are represented by white space. (b) Steady-state levels of PAS peptides compared with WT PAS[173-289] in E. coli BL21(DE3). Aer2 peptide expression was induced with 100 μM IPTG, and protein levels were determined from Western blots. (See the example in the inset box. Lanes are from the same gel; intervening lanes are represented by white space.) Error bars represent the standard deviations from multiple experiments.

