FIG 1.

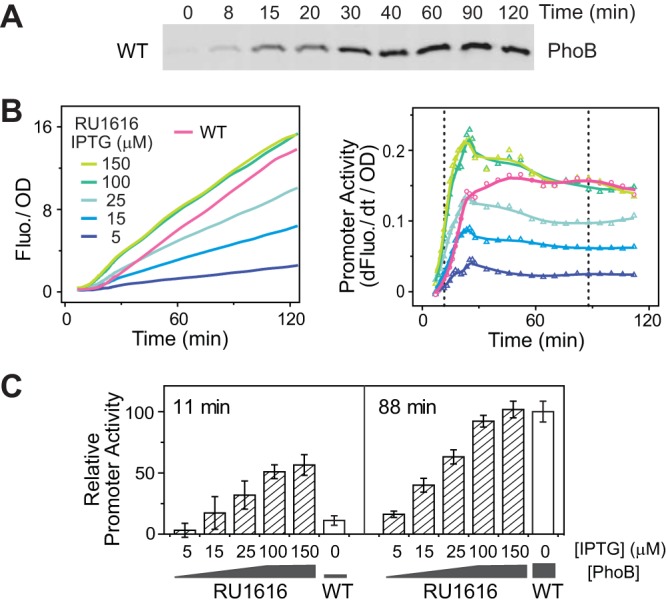
Expression levels of phoBR affect activation kinetics of phoA-yfp. (A) Time-dependent expression of PhoB upon Pi starvation. One immunoblot representative of four replicates is shown. (B) Temporal dynamics of phoA-yfp activation upon Pi starvation. Data representing OD-normalized fluorescence (Fluo.) are shown in the left panel, and data representing the first derivative of fluorescence (dFluo./dt) are shown in the right panel. The first derivative of fluorescence measures the rate of YFP synthesis, reflecting the promoter activities. BW25113 (WT) and RU1616 (a strain containing a phoBR operon under the control of an IPTG-inducible promoter) carrying the pRG161 reporter plasmid were assayed for Pi starvation response in MOPS medium with a starting concentration of Pi of 2 μM. Dotted lines represent two time points at which the relative promoter activities were compared in panel C. (C) IPTG concentrations of 5, 15, 25, 100, and 150 μM resulted in PhoB expression levels of 0.93, 1.7, 2.4, 8.1, and 8.2 μM in RU1616, while Pi limitation raised the PhoB level in the WT strain from 0.43 to 9.3 μM (28). Data are shown as means ± standard deviations (SD) of results from 11 individual wells assayed in a single microplate.
