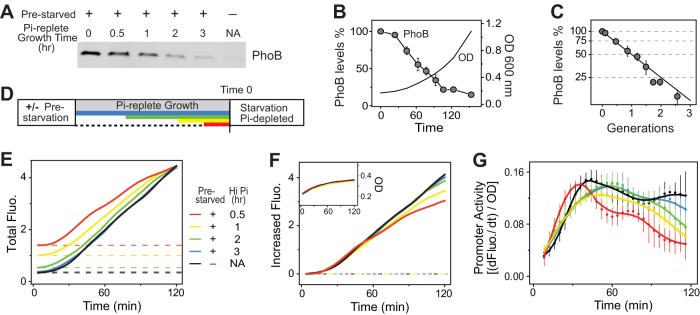
FIG 2.
Activation kinetics is dependent on growth dilution time for prestarved WT cultures. (A to C) Growth dilution of PhoB levels. Cells prestarved of Pi for 50 min were grown in Pi-replete medium (1 mM Pi) for the indicated times. One representative of six immunoblots is shown in panel A (NA, not applicable). Other immunoblots with more time points were used for the PhoB quantifications shown in panels B (time) and C (generations). Growth ODs were converted to values representing doubling generations of bacteria by exponential fitting of the growth curve to replot the data in panel C. The solid line represents the theoretical growth dilution curve. (D to G) Activation kinetics of phoA-yfp for prestarved WT cultures. The experimental timeline is shown in panel D. Different times of growth dilution in Pi-replete medium are represented in colors. The time of cells reencountering Pi-depleted medium is set as time zero. Total fluorescence (E), the increased fluorescence upon stimulation (F) and bacterial OD (inset in panel F), and promoter activities (G) are illustrated with smoothed solid lines. Dashed lines in panel E indicate different initial levels of fluorescence after the growth dilution, and these values were subsequently subtracted to give the newly increased fluorescence shown in panel F. Error bars represent SD of results from 11 individual wells.

