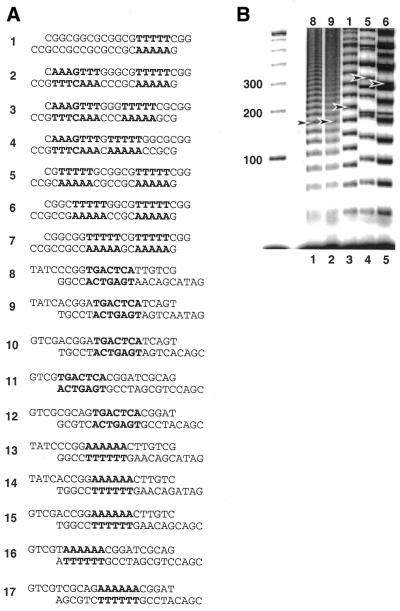
Figure 2.
Comparative electrophoresis experiments. (A) DNA duplexes under investigation. The primary sequence elements of interest are indicated in bold. Top strands are written such that the 5′-terminus is at the left. (B) Image obtained after native PAGE of ligation products of duplexes 8, 9, 1, 5 and 6. Ladder markers (100 bp) are shown at left (M). Arrowheads indicate molecules containing seven duplexes ligated end-to-end (147 bp).

