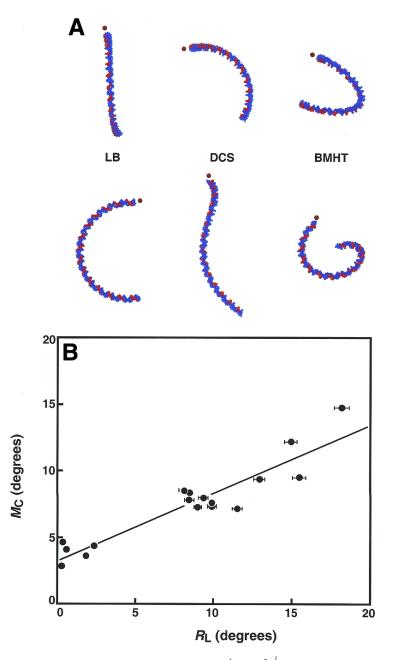
Figure 3.
Analysis of comparative electrophoresis experiments. (A) End and side views of 147 bp ligation products of duplex 5, predicted from the dinucleotide models LB, DCS and BMHT, respectively. A5 tracts are indicated in red. Dots indicate equivalent ends. These ends project towards the reader in top views. Only the LB model properly predicts a planar structure. (B) Relationship between modeled and measured DNA curvature. Data are plotted as the modeled curvature (MC) versus relative curvature (RL) measured in electrophoretic experiments. A5 tracts were assigned a value of 18° of curvature.

