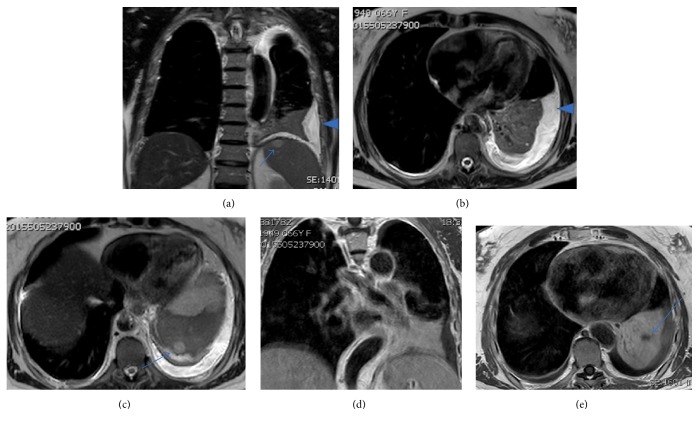
Figure 10.
Thoracic MR images. Fluid sensitive sequences (a–c) show the presence of left pleural effusion (arrowhead) and also the nodular lesions in the spleen, which do not correspond to cysts (arrows). T1 weighted images with contrast (d and e) show the pulmonary mass and hypodense zones representing necrotic areas (arrow).

