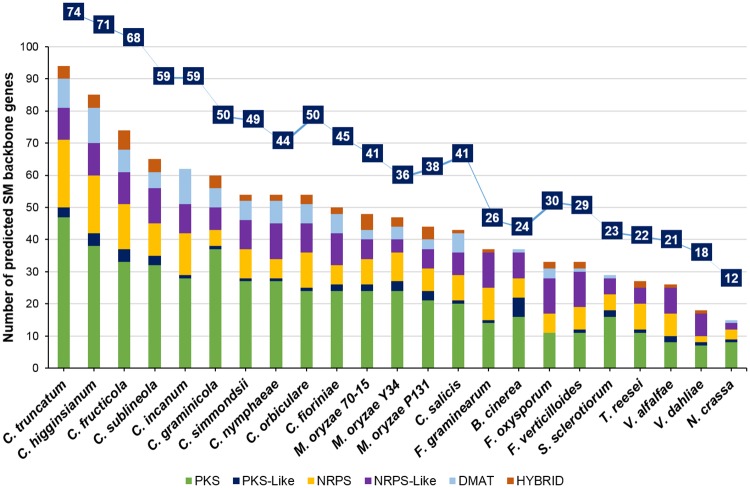
Fig 7. The comparative analysis of secondary metabolite (SM) gene clusters (line graph) and SM backbone genes (bar graph) predicted in different fungi using SMURF.
Colletotrichum species had maximum expansion of SM backbone genes among all the fungi analysed, while Verticillium species showed contraction of these genes.

