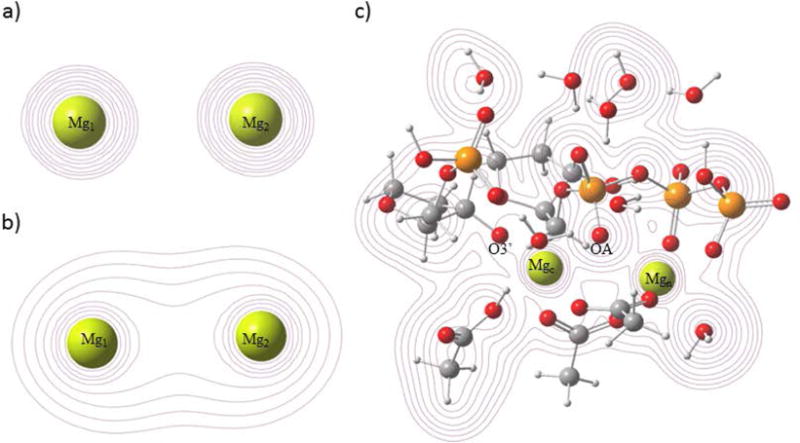
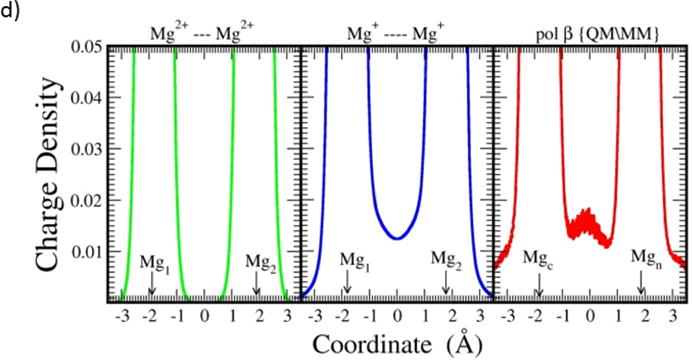
Figure 4. Electron density.


a) A contour map of the charge density for [Mg2]4+ at the Mg-Mg separation of 3.63 . This distance is chosen for display because it is the Mg-Mg distance in the initial state of an ongoing QM/MM model study based on pdb ID 2FMS. b) A contour map of the charge density for [Mg2]2+ at the same Mg-Mg separation of 3.63 . (c) A contour map of the charge density of the QM sub-system (Methods) of pol β from the QM/MM calculations. As seen in Figure 2, the system is likely metastable at this distance. The scaffold resulting from the interaction between OA and the two metals is evident. The initial formal charge on each metal ion is +2 for the quantum calculations. d) The charge density (in ) calculated along the line connecting the two metal centers for the three systems shown above. Metal ion positions are shown with arrows.
