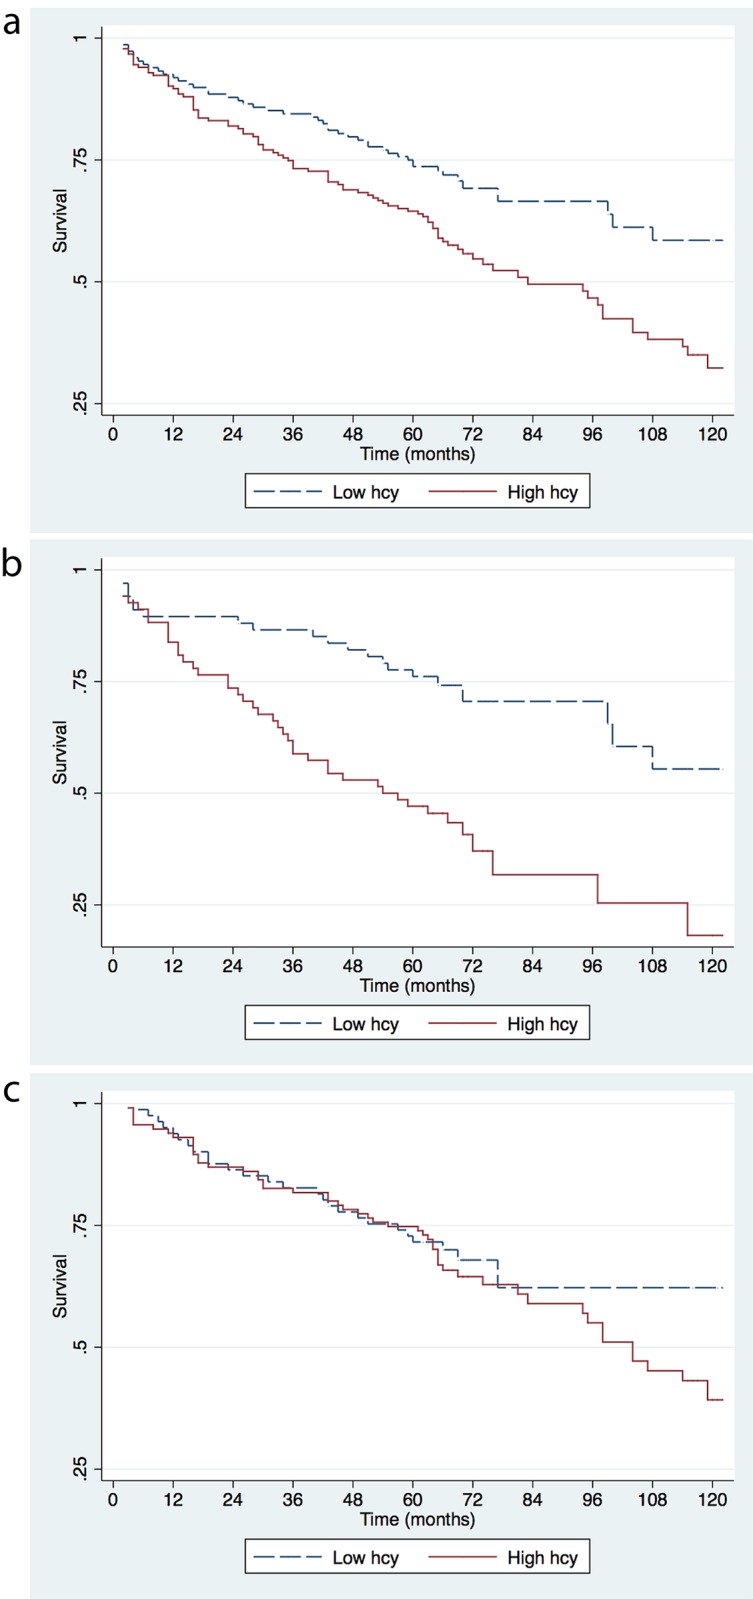
Fig 1. Kaplan-Meier survival curves for 10-year observation of 1-month survivors by tHcy status.

The analyses were performed for all patients (a), for women (b), and men (c).

The analyses were performed for all patients (a), for women (b), and men (c).