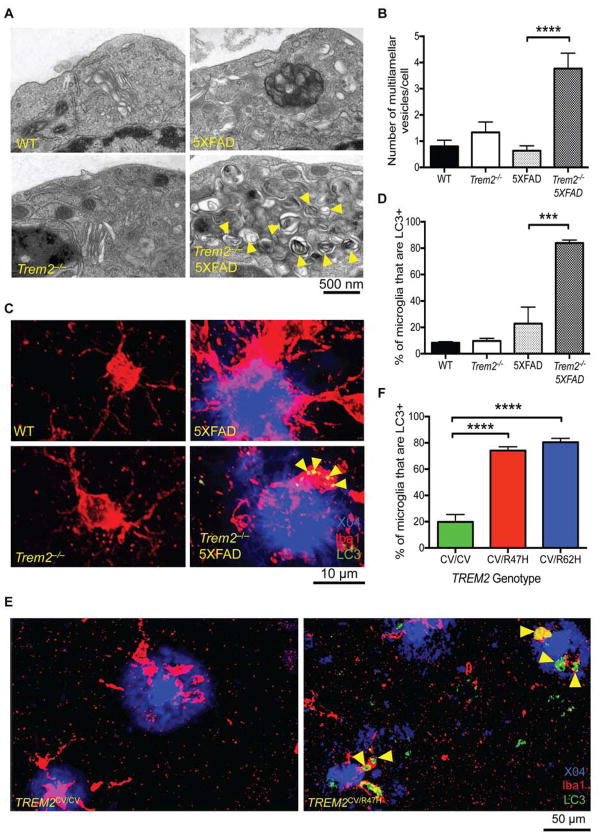
Figure 1. Defect in TREM2 enhances autophagy in vivo in the 5XFAD mouse model and in AD patients.
(A) TEM images of microglia (CD45+, CD11b+, F4/80+ cells) sorted from 8-month-old WT, Trem2−/−, 5XFAD, and Trem2−/− 5XFAD mice.
(B) Average number of multivesicular and multilamellar structures/cell (30 cells analyzed/genotype).
(C) Confocal images of plaque bearing regions of the cortex (1.1 mm Bregma to 0.8 mm Bregma) of 8-month-old WT, Trem2−/−, 5XFAD, and Trem2−/− 5XFAD mice show Iba-1+ microglia (red), methoxy X04+ plaques (blue), and LC3 (green). Z-stacks composed of ~30 images taken at 1.2 μm intervals were analyzed. Results are reported as an average of 2 regions of interest (ROI) analyzed.
(D) Quantification of the % of microglia that are positive for LC3 puncta. ~150–400 microglia/HPF were analyzed depending on the genotype of the animal.
(E) Confocal images of sections from post-mortem brains of R47H+ AD patients and case-matched controls (CV, common variant of TREM2) show Iba-1+ microglia (red), methoxy X04+ plaques (blue), and LC3 (green). 3 ROIs/donor were analyzed and between 400 and 700 microglia/individual were analyzed.
(F) Percentages of LC3+ microglia in post mortem specimens of AD patients with different genotypes.
*** p<0.005, ****p<0.001 by One-way ANOVA with Holm-Sidak’s multiple comparisons test. 15 cells from 2 separate mice were visualized for TEM (A, B). Confocal images are representative of 3 female mice per group (C, I) or 7 R47H, 4 R62H, and 8 case matched AD patients for post-mortem specimens (E). Immunoblots are representative of 3 independent experiments from microglia from 3 separate mice per group (G). Arrowheads indicate multilamellar and multivesicular structures (A) or LC3+ vesicles (C, E, I). See also Figure S1 and Table S1.

