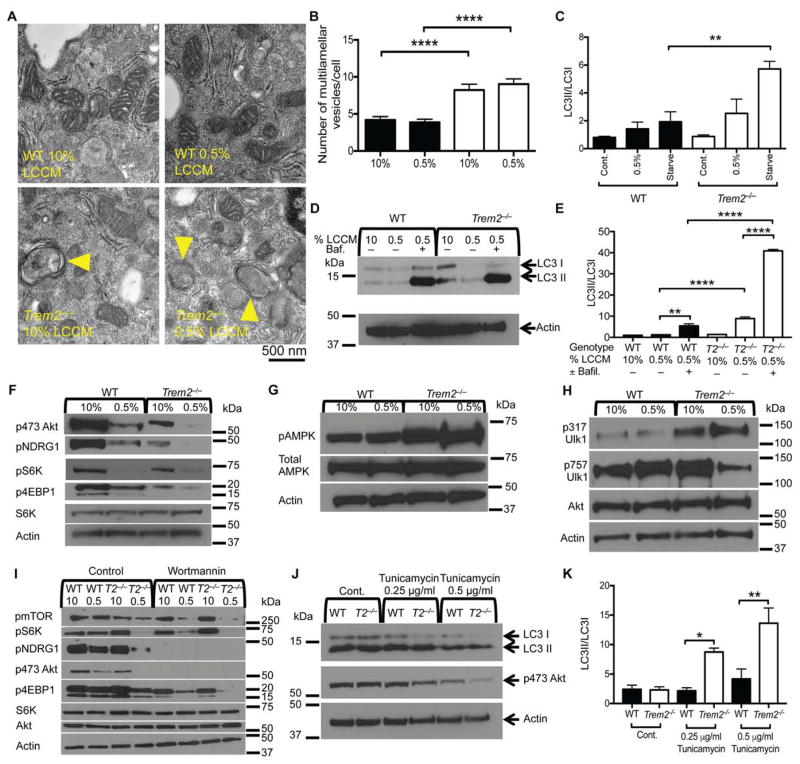
Figure 3. TREM2 deficiency affects mTOR signaling and induces autophagy in BMDM.
(A) TEM images of WT and Trem2−/− BMDM cultured overnight in either in 10% or 0.5% LCCM as source of CSF1.
(B) Number of multivesicular structures/cell observed in the TEM images. 30 cells/genotype and condition were analyzed.
(C) Quantification of the LC3II/LC3I ratio in BMDMs from WT and Trem2−/− mice cultured in 10% or 0.5% LCCM overnight or starved in HBSS for 4 hours prior to lysis.
(D) Immunoblots for LC3 and actin performed on lysates from WT and Trem2−/− BMDMs cultured in 10% or 0.5% LCCM overnight. Cell were treated with bafilomycin for 5 hours prior to harvest at a final concentration of 0.5 μg/ml
(E) Quantification of LC3II/LC3I ratio in BMDMs from WT and Trem2−/− mice treated as indicated.
(F–H) Immunoblots for phosphorylated Akt (serine 473), NDRG1, S6K, 4EBP1, (F), AMPK, (G), Ulk1 (serine 317 and serine 757) (H) and relative controls. Lysates were from WT and Trem2−/− BMDM cultured overnight in 10% or 0.5% LCCM
(I) Immunoblots for phosphorylated Akt (serine 473), NDRG1, S6K, 4EBP1, mTOR, total S6K, Akt, and actin performed on lysates from WT and Trem2−/− BMDMs cultured overnight in 10% or 0.5% LCCM followed by the addition of wortmannin for 3 hours prior to harvest.
(J, K) Immunoblots for LC3 and phosphoserine 473 Akt in WT and Trem2−/− BMDM cultured in 10% LCCM with the indicated concentration of tunicamycin. Bar graph shows LC3II/LC3I ratios.
Error bar represents mean ± SEM. *p<0.05, **p<0.01, or ****p<0.001 by One-way ANOVA with Holm-Sidak’s multiple comparisons test (B, C, E, K). Data are representative of at least 3 independent experiments. Arrowheads indicate multilamellar and multivesicular structures (A). See also Figure S3.

