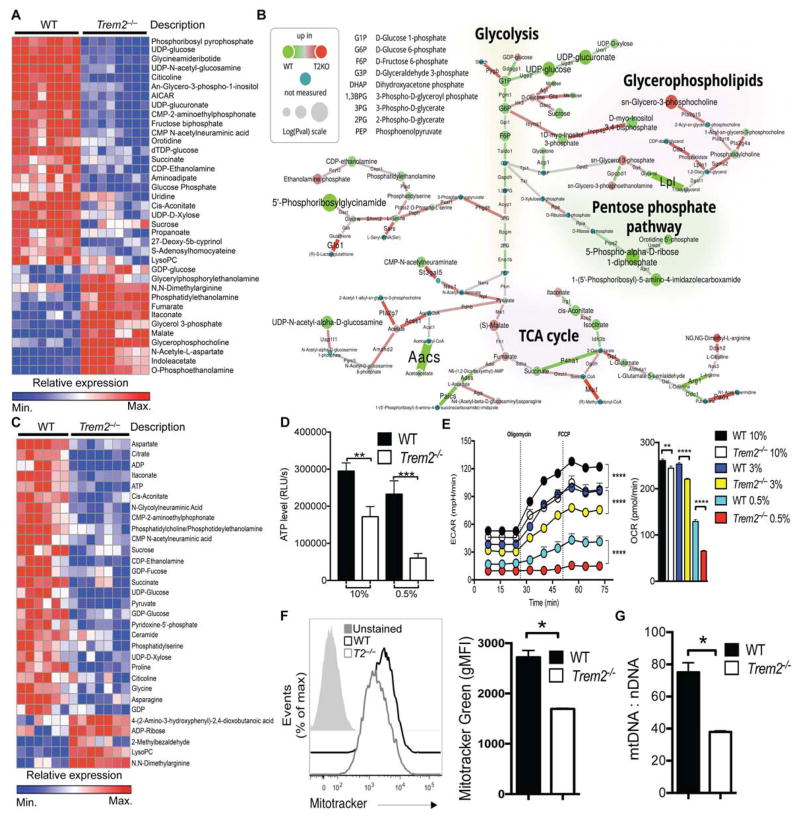
Figure 4. TREM2 deficiency reduces anabolic and energetic metabolism in BMDM.
(A) Top most changed metabolites between WT and Trem2−/− BMDM cultured overnight in 10% LCCM. Defined as p≤0.01 and identified in the mouse metabolic network analysis in B.
(B) Shiny-genes and metabolites (GAM) output for network analysis combining mass spectrometry and RNA-seq data highlights differences between WT and Trem2−/− BMDM cultured in 10% LCCM. Enzyme-encoding mRNAs and metabolites downregulated or upregulated in Trem2−/− cells vs WT cells are indicated with green or red nodes and connectors, respectively.
(C) Top most changed metabolites between WT and Trem2−/− BMDM cultured in 0.5% LCCM. Defined as p≤0.01 and identified in the mouse metabolic network analysis in Fig. S4C.
(D) ATP content of WT and Trem2−/− BMDM cultured in the indicated concentration of LCCM overnight.
(E) Extracellular acidification rate (ECAR) and baseline oxygen consumption rate (OCR) by WT and Trem2−/− BMDM cultured overnight in the indicated concentration of LCCM.
(F, G) Mitochondrial mass of WT and Trem2−/− BMDM assessed by Mito Tracker Green incorporation (F) and by the ratio of mitochondrial-to nuclear DNA (G).
Error bar represents mean ± SEM. *p<0.05, ** p<0.01, or ****p<0.001 by One-way ANOVA with Holm-Sidak’s multiple comparisons test (C) or Student’s T test (F, G). Data are representative of at least 3 independent experiments. See also Figure S4.

