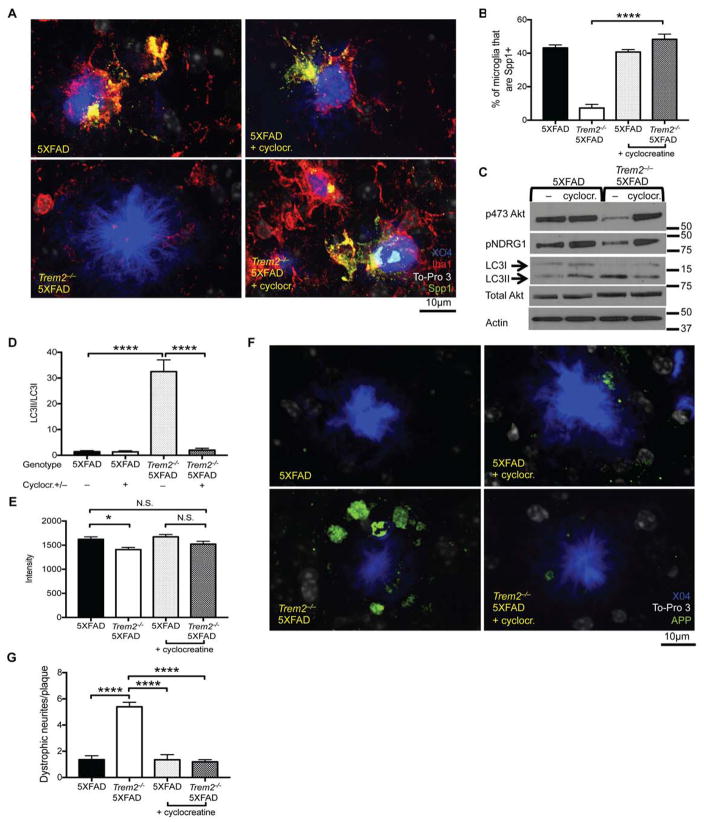
Figure 7. Energy Supplementation Can Offset Neuronal Damage in TREM2 Deficient 5XFAD mice.
(A) Representative images depicting plaques (X04 in blue), nuclei (To-Pro3 in white), microglia (Iba-1 in red), and Spp1 (in green) staining in cortexes of mice from the indicated genotypes.
(B) Quantification of the percentage of microglia that were Spp1+ in the indicated genotypes of mice. Confocal images were taken as in Figure 1C.
(C) Immunoblots performed on lysates of microglia sorted from the indicated genotype and treatment group of mice. Immunoblots for phosphorylated Akt (serine 473), NDRG1, total LC3, Akt, and actin.
(D) Quantification of the LC3II/LC3I ratio observed in immunoblots from 3 mice of each of the indicated genotypes and treatment groups.
(E) Average intensity of the plaques observed in the cortexes of mice from the indicated genotypes and treatment groups.
(F) Representative images depicting plaques (X04 in blue), nuclei (To-Pro3 in white), and N-terminus APP (green) from the indicated mice and treatment groups. Confocal images were taken as in Figure 1C.
(G) Quantification of the number of dystrophic neurites/plaque in the indicated mice and treatment group.
N.S. indicates not significant, *p<0.05, and ****p<0.001 by One-way ANOVA with Holm-Sidak’s multiple comparisons test (A, C, D, F) results pooled from 2 independent experiments representing a total of 5–8 male and female mice per treatment group. See also Figure S5.

