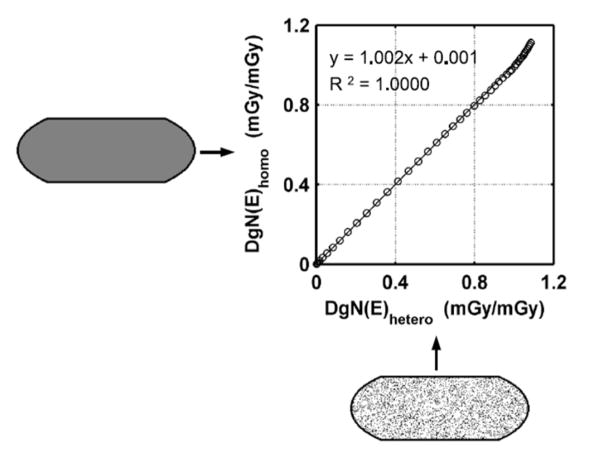
Figure 13.
This figure illustrates monoenergetic DgN coefficients calculated by use of both the homogeneous assumption (vertical axis) and the heterogeneous model with a homogeneous distribution (horizontal axis). Excellent correspondence is illustrated, showing the accuracy of the discrete-voxel heterogeneous model.
Adapted from a figure in reference 36

