Figure 6.
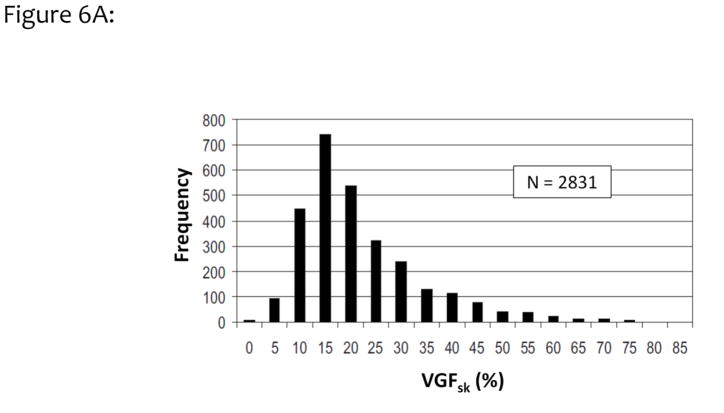
Figure 6A. The data from UC Davis and University Toronto were combined, resulting in this histogram of the distribution of volume glandular fractions for 2831 women residing in North America. Less than 5% of women have volume glandular fractions greater than 50%, based upon these data.
Adapted from a figure in reference 32.
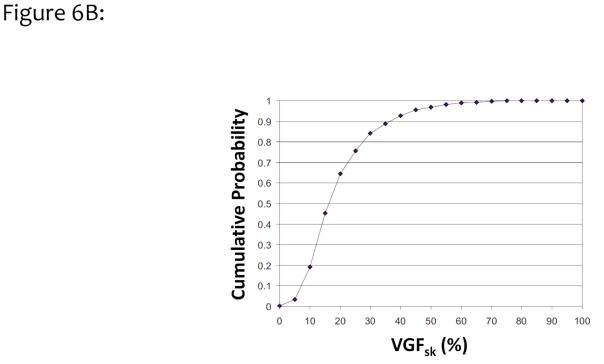
Figure 6B. The data shown in Fig. 6A were integrated to demonstrate the cumulative probability distribution of breast density as a function of VGF. These data illustrate that the median woman has approximately 16% VGF.
Adapted from a figure in reference 32.


