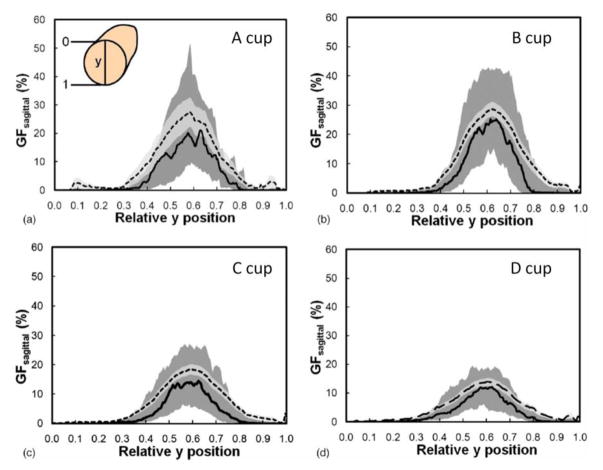
Figure 9.
These four figures illustrate the radial distribution of glandular tissue for breasts classified by bra cup size (A to D). As the breast size changes, the distribution of the glandular components of the breast are approximately normally distributed, with lower VGF at the periphery of the breast and higher VGF levels towards the center.
Adapted from a figure in reference 33.

