
Fig. 5.
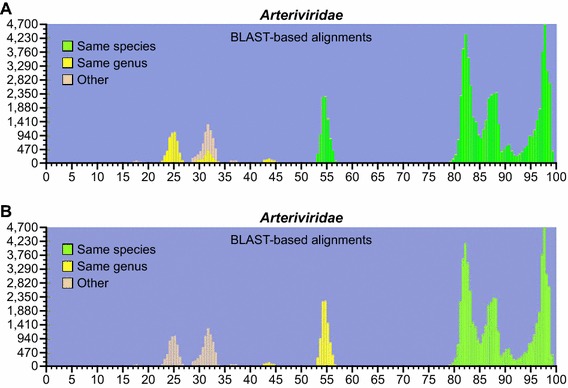
PAirwise Sequence Comparison (PASC) analysis using a modified basic local alignment search tool (BLAST) algorithm [11]. The resulting histograms, visualizing the distribution of the number of arterivirus pairs at each identity percentage, confirm results shown in Figure 3. The x-axis shows percent identity (0–100 %) and the y-axis shows the number of compared arterivirus sequence pairs. A) original color coding assigned by the NCBI PASC tool, showing disarray. B) reassigned color coding after implementation of the arterivirus taxonomy proposed herein (color figure online)