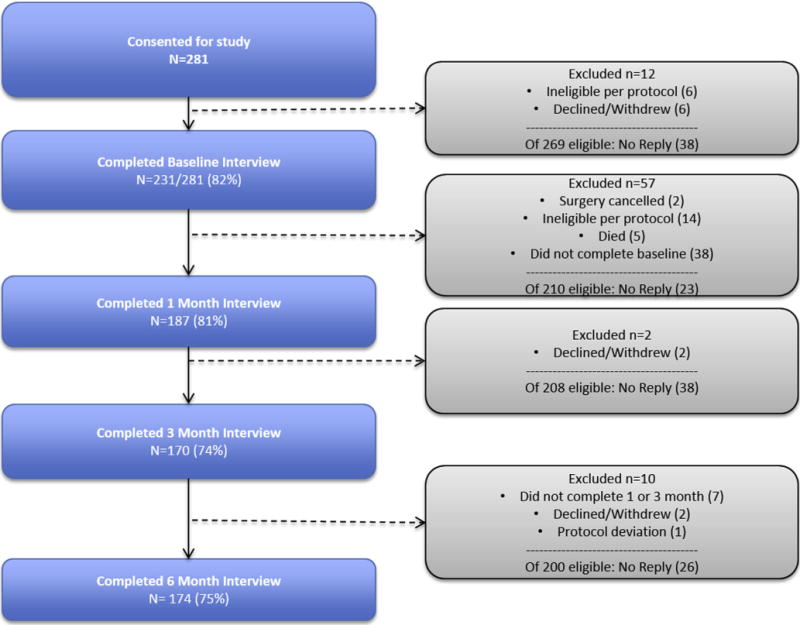
FIGURE 1. Study population.

Response rate percentages represent respondents/eligible respondents, as detailed in right-sided bubbles. After completion of baseline interview, participants could miss 1 of 3 follow-up interviews and remain in study. For 1-month primary outcome, 2 patients were missing complete clinical records, yielding final primary cohort of N = 185. Participation rate at 1, 3, and 6 months is based on cohort that completed baseline interview (n = 231).
